The Production Cockpit is the central dashboard for monitoring shop-floor activity in the Beas Web Client. It consolidates production status, performance KPIs, resource availability, active work orders, and material shortages into a single screen so production planners and supervisors can spot bottlenecks and act in seconds.
This cockpit is a complete redesign of the existing desktop cockpit with visual improvements, two new KPI cards (Schedule Adherence and Production Efficiency), and direct navigation to Material Requirements and Inventory History.
Accessing the view
The Production Cockpit lives in the Beas Web Client and is opened from a dedicated tile in the SAP Web Client launchpad.
Direct URL: views/cockpit
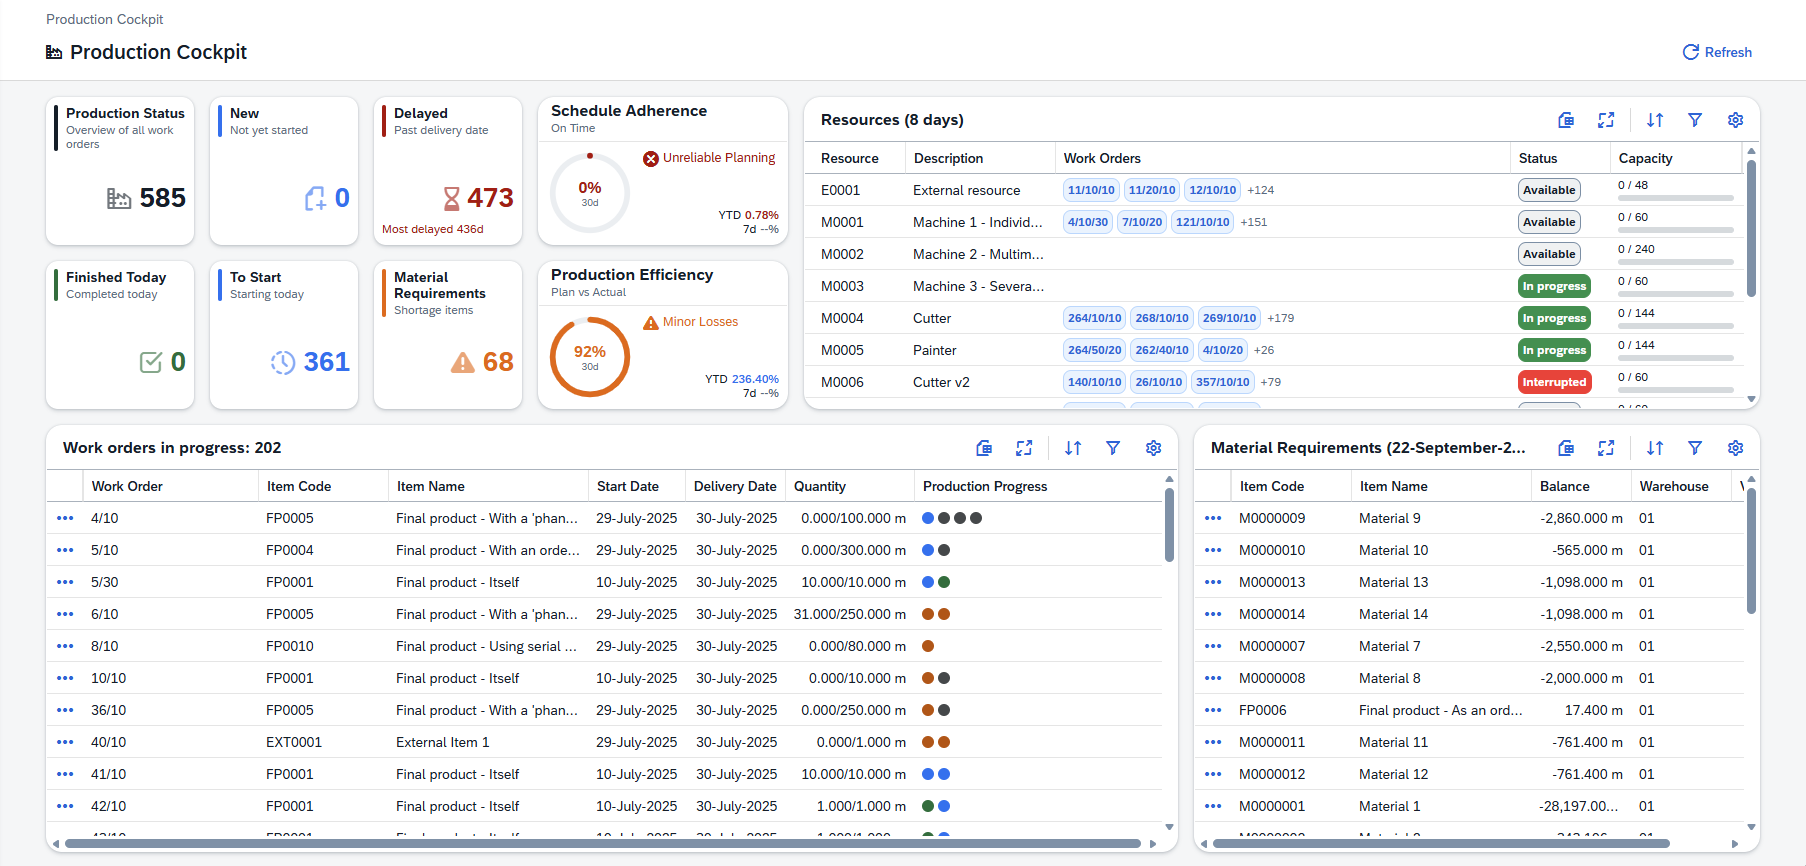
Opening the Cockpit
1.Open the SAP Web Client launchpad.
2.Click the Production Cockpit tile.
The cockpit opens in the Beas Web Client and shows live data for the active company. Use Refresh in the header to reload all values.
Sections of the Cockpit
The cockpit is divided into five sections that can be read independently:
•Production status — high-level counts of the work orders currently open.
•Performance KPIs — two gauges that score schedule adherence and production efficiency.
•Resources — availability and load of every production resource over the next few days.
•Work orders in progress — list of active work orders with their progress.
•Material requirements — items in shortage according to the latest calculation.

|
The following controls are available (where applicable) with the Beas Web Client.
Navigation bar When viewing a material or operation detail page, you can navigate between positions without returning to the list view. A navigation toolbar with four arrow buttons is available at the top of the page:
A Refresh The navigation order follows the position ordering from the list view (respecting any active sort). Navigating between positions updates the URL, breadcrumb, header, and all form sections in place. Navigation wraps around: pressing Next on the last position moves to the first, and vice versa. Quick Review Workflow: Use the navigation arrows to quickly review all materials or operations in sequence. This is particularly useful during BoM audits or routing reviews, where you need to inspect each position without repeatedly returning to the list.
Sorting, freezing usability
Filter window
Search field: Search by the indicated prompts or click the browse button
Grid Tool bar The grid toolbar above the results table provides several actions for working with the data:
You can also click any column header directly to sort by that column, or drag a column header to the grouping area to group by that column.
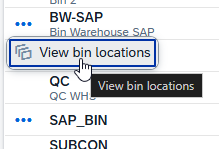
Action Buttons Action buttons appear only when applicable for a column. You can access them by clicking on the three dots left of the relevant field:
|


 button is also available to reload the current position's data from the server without navigating away.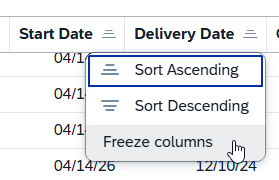

 where applicable for multiple selection.


Six tiles give an immediate snapshot of the work in the shop floor. Each tile shows a single number so it can be read at a glance.
Tile |
Description |
|---|---|
Total Orders |
The number under the filter represents the count of all work orders. |
New |
Work orders that have been created but have not been started yet. Use it to see the backlog waiting to enter production. |
Delayed |
Work orders with delivery dates already in the past. The footer "Most delayed: X days" highlights the worst case so you can prioritize recovery. |
Finished Today |
Work orders completed during the current day. A live indicator of today's output, useful for end-of-shift reviews. |
To Start |
Work orders scheduled to start today. Helps confirm that planned starts are actually being released to production. |
Material Requirements |
Number of items currently in shortage. Click the tile to jump straight to the full Material Requirements view. |
Two gauges score how well production is performing. The main value covers the last 30 days; below each gauge the YTD (year to date) and last 7 days values are shown so you can compare short-term against long-term trends.
Schedule Adherence
Percentage of work orders completed on or before their planned finish date. Higher is better.
Range |
Label |
Indicator |
|---|---|---|
≥ 95 % |
Excellent |
Informative |
≥ 85 % |
Good |
Positive |
≥ 70 % |
Execution Issues |
Critical |
< 70 % |
Unreliable Planning |
Negative |
Production Efficiency
Compares planned vs. actual time and material consumption. Higher efficiency means less time and fewer materials were used than originally planned.
Range |
Label |
Indicator |
|---|---|---|
≥ 100 % |
Above Standard |
Informative |
≥ 95 % |
Expected |
Positive |
≥ 85 % |
Minor Losses |
Critical |
< 85 % |
Inefficiencies |
Negative |
Shows every production resource together with its workload for the period indicated in the card title (Resources (N days)). The number of days comes from the Beas configuration, so it can vary from one company to another. Use this section to spot resources that are overbooked or sitting idle.
Column |
Description |
|---|---|
Resource |
Resource code. |
Description |
Resource name. |
Work Orders |
Work orders scheduled on the resource within the period. A +N badge appears when there are more work orders than fit in the cell. |
Status |
Current state of the resource: Available, In progress or Interrupted. Hover the chip for an extended tool tip: •In progress — employee, start date, work order operation and item being produced. •Interrupted — employee, start date, interruption code and reason. •Available — if a next operation is already scheduled, the tooltip shows the upcoming work order operation and item. |
Capacity |
Used vs. total capacity for the period, with a colour-coded bar: < 70 % ≥ 70 % ≥ 90 %. |
Lists every work order that is currently active. The total count is shown in the card title (e.g. Work orders in progress: 202) so you always know how many are running.
Column |
Description |
|---|---|
Work Order |
Work order ID and position (WO/Pos) that uniquely identify the order. |
Item Code / Item Name |
Item being produced by the work order. |
Start Date / Delivery Date |
Planned start date and the date by which the work order is expected to be delivered. |
Quantity |
Quantity already produced and the total quantity planned, separated by a slash. |
Unit of Measure |
Unit of measure used for the quantity column. |
Production Progress |
One coloured circle per operation in the work order, showing the status of each step: Not started Already started In progress Completed. The tooltip on each circle is headed by WO / Position / Operation and the status, and adds: •Not started — only the header. •Already started — list of time receipts already booked (employee, quantity made, start date). If there are more than three, the count of extra receipts is shown. •In progress — the employee currently working, the resource and the start date of the open receipt. •Completed — list of time receipts that closed the operation (employee, quantity made, start date), with the extra-receipt count when needed. |
Row action
Click the row's actions menu (…) and choose Material Requirements to open the Material Requirements view filtered to that work order.
Lists items currently in shortage according to the latest material requirements calculation. The card title shows the date and time of that calculation (e.g. Material Requirements (09-22-25 05:24 PM)) so you know how fresh the data is.
Column |
Description |
|---|---|
Item Code |
Code of the item that is missing. |
Item Name |
Item description. |
Unit of Measure |
Unit of measure used in the balance column. |
Balance |
Net availability after demand has been deducted. Negative values indicate the size of the shortage. |
Warehouse |
Warehouse to which the requirement belongs. |
Version |
Calculation scenario (when several scenarios coexist). |
Row action
Click the row's actions menu (…) and choose Inventory History to open the Inventory History view for the item — the fastest way to investigate where the shortage comes from.
No calculation available: If the material requirements calculation has never been run, the grid is replaced by a message indicating that no calculation date is available.
Refreshing data
The cockpit does not auto-refresh. Use the Refresh button in the top-right corner of the page header to reload all tiles, KPIs and grids.
Tips
Personalize grids: Each grid stores its column visibility, order, sort and filters per user. Use the Settings icon to show or hide columns — your selection is remembered the next time you open the cockpit.
Full-screen mode: Use the full-screen icon in any grid to expand it — great for shop-floor displays.
Quick navigation: The Material Requirements tile and the row actions in the bottom grids let you jump to the related view without losing the cockpit context — use the browser back navigation to return.
Tool tips everywhere: Hover the resource Status chips and the work order Production Progress circles for extended details about each item.