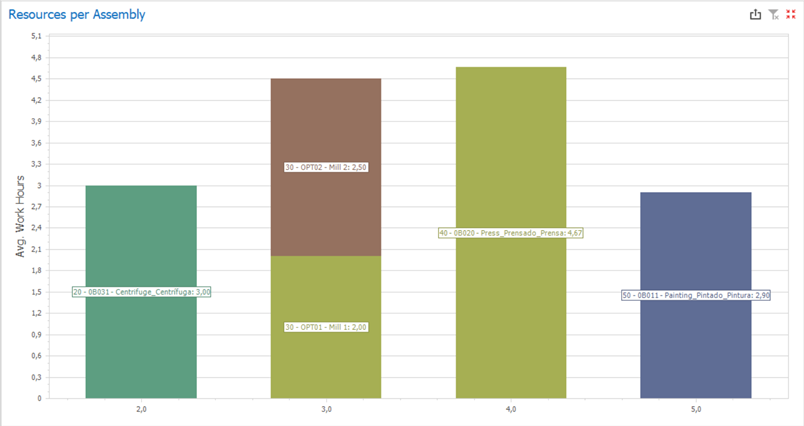
This chart displays the average net work time for each routing position used in the different production processes, making it easier to see variations in productivity and understand the steps that are making the processes slower. When more than one resource was used in a same routing position (like in the cases of alternative resources), they are both displayed on the chart, each one of them with its current average work time.