The Production dashboard contains a series of analytical views over the executed production. The data can be filtered using the pre-made filters for defined time ranges (last 12 months, this year, last year, this quarter, last quarter, this month and last month). Manual filtering can be done by clicking on “Set Filter…”.
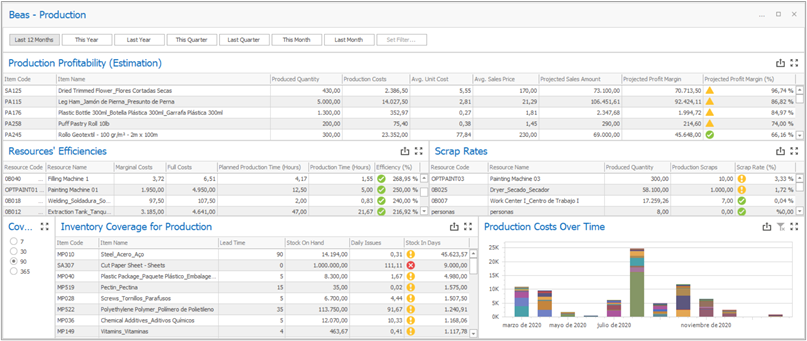
The Production Analysis dashboard includes the following four tabs: