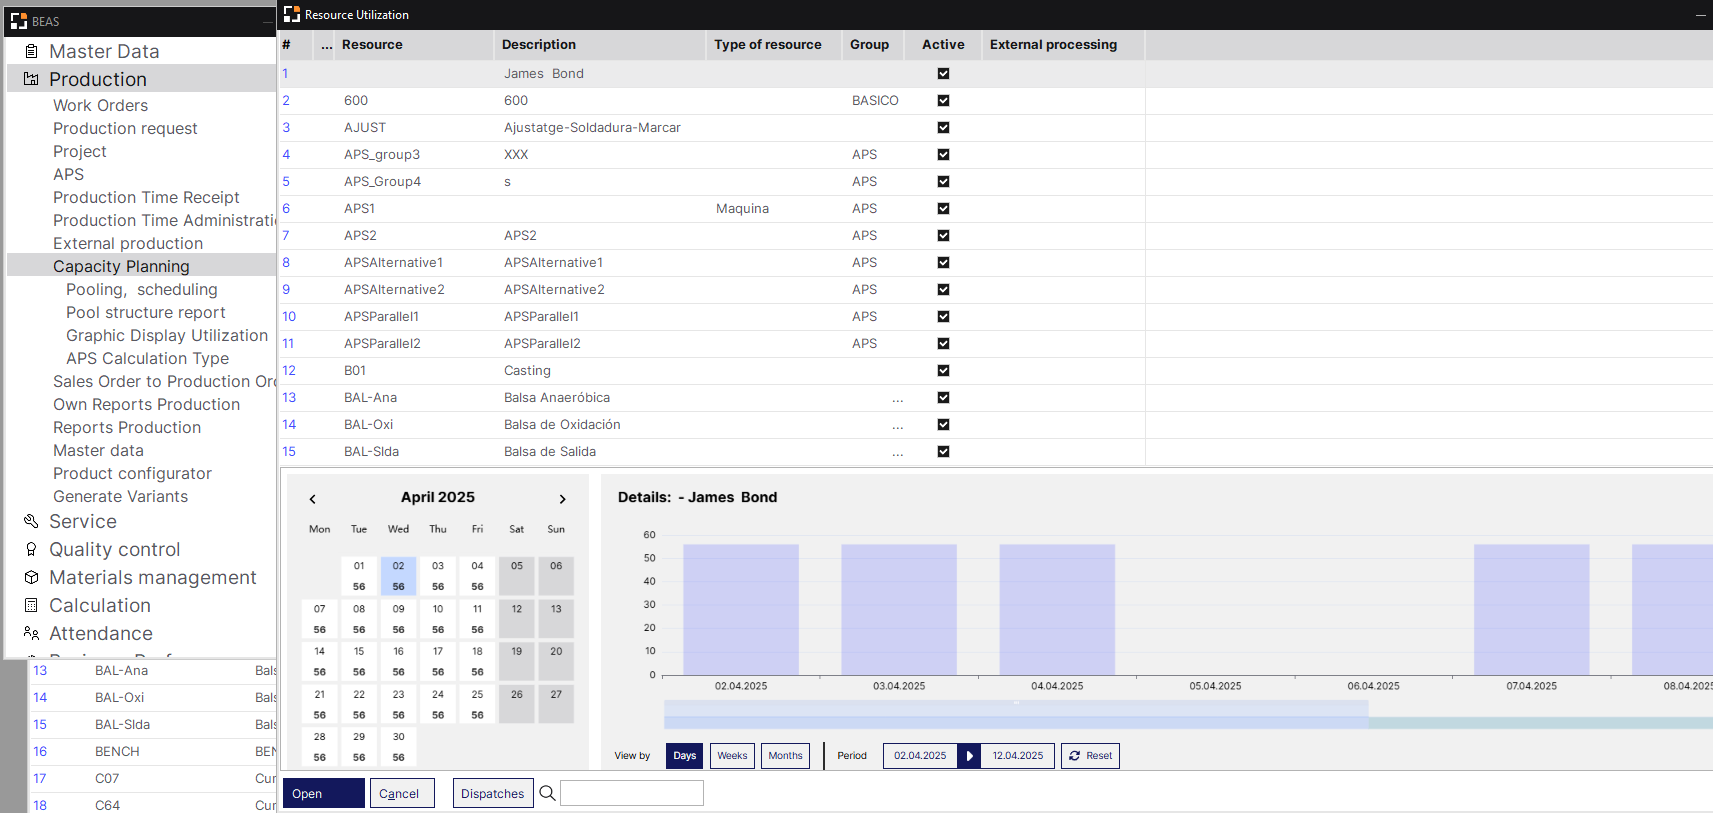
In the graphic utilization display, the planned times can be displayed by day, week, or month for each resource.
Window kapa_arbplatz_edit.psr
Graphical display
The graphical display provides a summary of all Resource utilization and the relevant details of a selected resource in a chart view.
You can dynamically set the window structure of your preference by selecting the placement of the graphical display in the contextual menu. The appearance is user-dependent and can be set in each screen individually.
Adjust display size by Ctrl + Scroll up/down.
Controls
Select resource or resource group from the list to be displayed. |
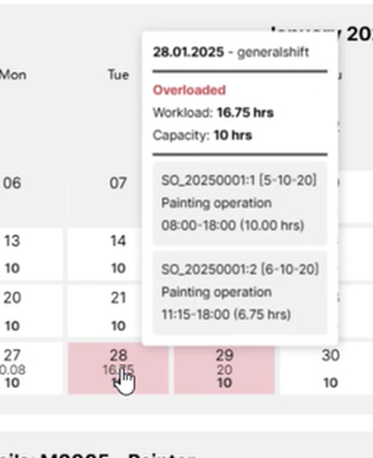
The calendar visualization provides a monthly overview at resource utilization. The number of resource capacity hours are indicated under the date numbers. Color codes and tool tips assist usability.
Color codes of calendar days:
•Grey: Non-labor day (no capacity or holiday) •Red: Day with overloaded capacity •White: Any day with capacity planning •Blue: the currently selected day
Hovering over a calendar day shows a tool tip on the relevant details of resource utilization:
Tool tips
Controls: Left-right arrows to navigate between calendar months. |
Workload / Time
This graphics section displays the capacity and workload (number of hours on the "Y" axis) of one, selected resource under a defined time range ("X" axis). You can select a resource to be viewed here for a period in the numbered list or by clicking on it in the "Resources summary" chart.
|
||||||||||||||||||||||||||
Functions
Button |
Meaning |
Day |
Utilization display on the right: by day. |
Week |
Utilization display on the right: summarized by week. |
Month |
Utilization display on the right: summarized by month. |
Dispatches |
Opens a list of dispatches for the selected resource. |
Work orders |
Not completed work orders containing the currently selected resource are opened in the work order structure. Alternative and parallel resources are considered. |
back to capacity planning