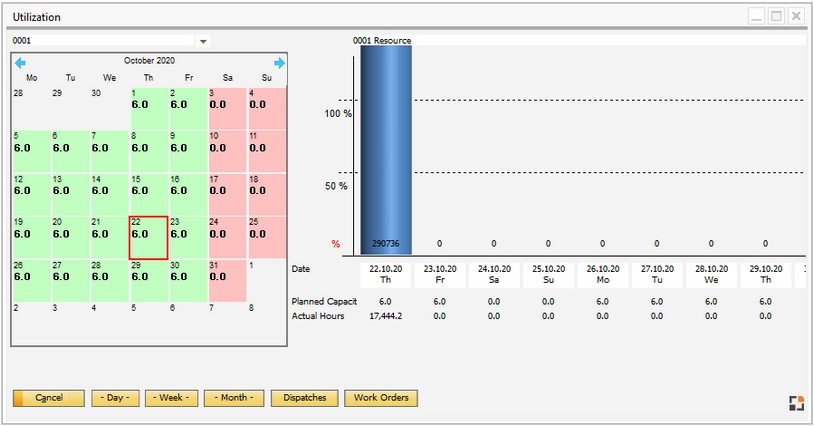
In the graphic utilization display, the planned times can be displayed by day, week, or month for each resource.
Window kapa_arbplatz_edit.psr
Controls
Select resource or resource group to be displayed. |
Select the start date for display. In weekly view, the week is displayed from Monday. For monthly view, the month is displayed from the 1. day.
Background color represents the planned time: Pink: Resource is not available |
Utilization is displayed in a bar chart. 100 % represents the available time in hours (planend capacity) for the time domain. A time domain may be a day, a week or a month. 11 time domains are displayed. The bar represents the utilization of the resource in percent for a given time domain.
Note: All dispatches in the past are moved in this view to the current day. Accordingly, for the current day an overload can occur. There is no display of past values.
Designation
Date = day, Week or Month for a time domain. |
Functions
Button |
Meaning |
Day |
Utilization display on the right: by day. |
Week |
Utilization display on the right: summarized by week. |
Month |
Utilization display on the right: summarized by month. |
Dispatches |
Opens a list of dispatches for the selected resource. |
Work orders |
Not completed work orders containing the currently selected resource are opened in the work order structure. Alternative and parallel resources are considered. |
back to capacity planning