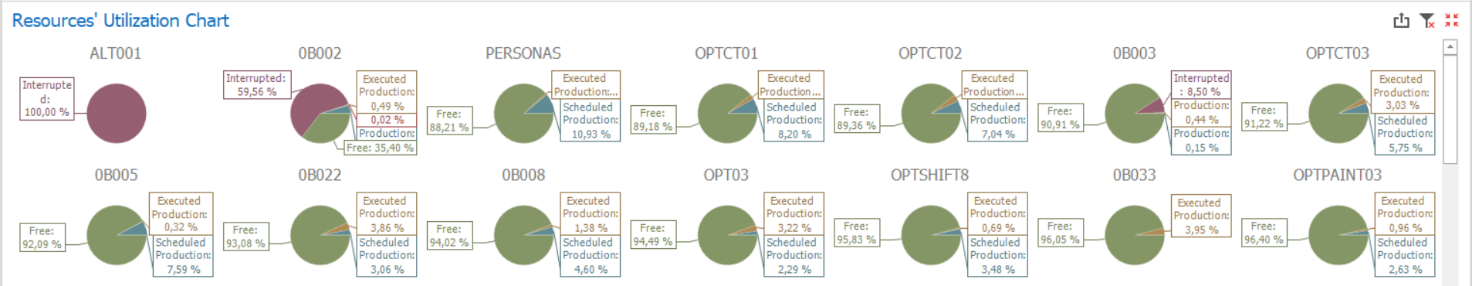
This pie chart shows how the capacities from each resource are used, slicing them into four parts (see detailed explanations under “ Capacity Usage Overview (Hours)”):
a)Interrupted: Total interruption hours registered for the resource;
b)Scheduled Production: Total scheduled (and not executed) work hours for the resource;
c)Setting Up: Total setup times registered for the resource;
d)Executed Production: Total work hours registered for the resource;
e)Free: Remaining capacity after discounting interruptions, scheduled work, setup times, and work times.
The resources are displayed according to the applied filter. For example, if you wish to check how all the resources will be occupied in the next seven days, you just need to select “Next 7 Days” on the time range filters. Then, if you wish to filter further for specific resource groups or resources, you can select them on the corresponding charts. The same can be done for filtering specific months, using the “Capacity Usage Overview” chart.,
The resources are displayed according to the applied filters. For example, if you wish to check how all the resources will be occupied in the next seven days, you just need to select “Today + 7 Days” on the time range filters. In the Resources’ Utilization chart, the utilizations are always represented in percentual values; to know the absolute values corresponding to the percentages of a specific resource, you just need to select the desired resource and check the results on the “Capacity Utilization Overview (Hours)” grid.
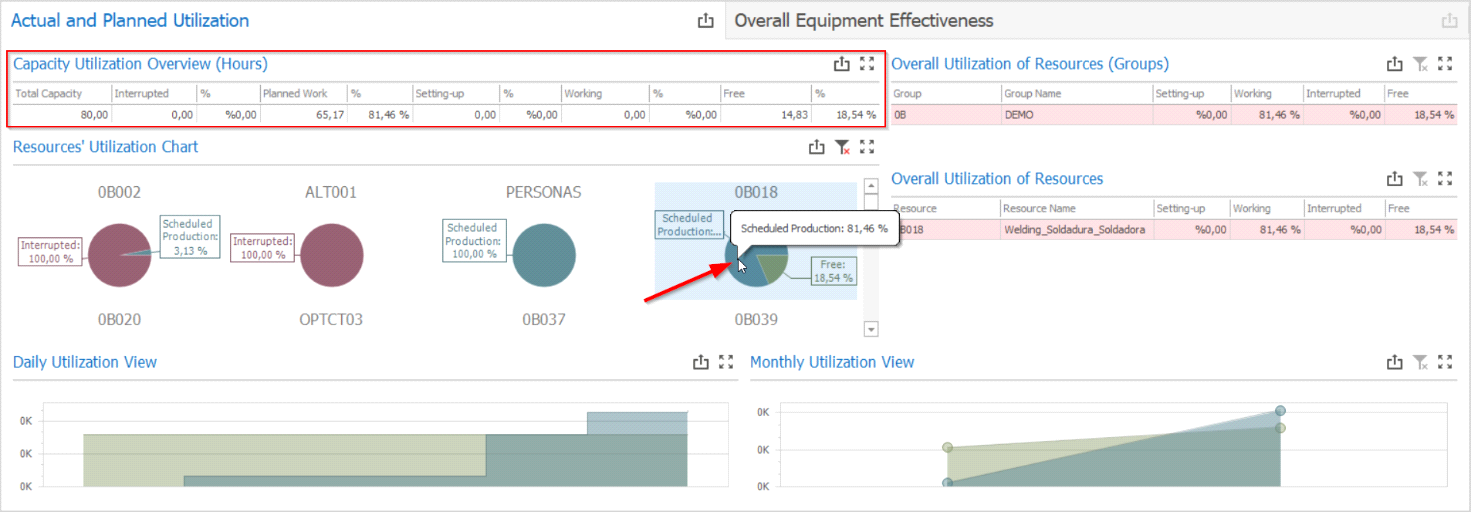
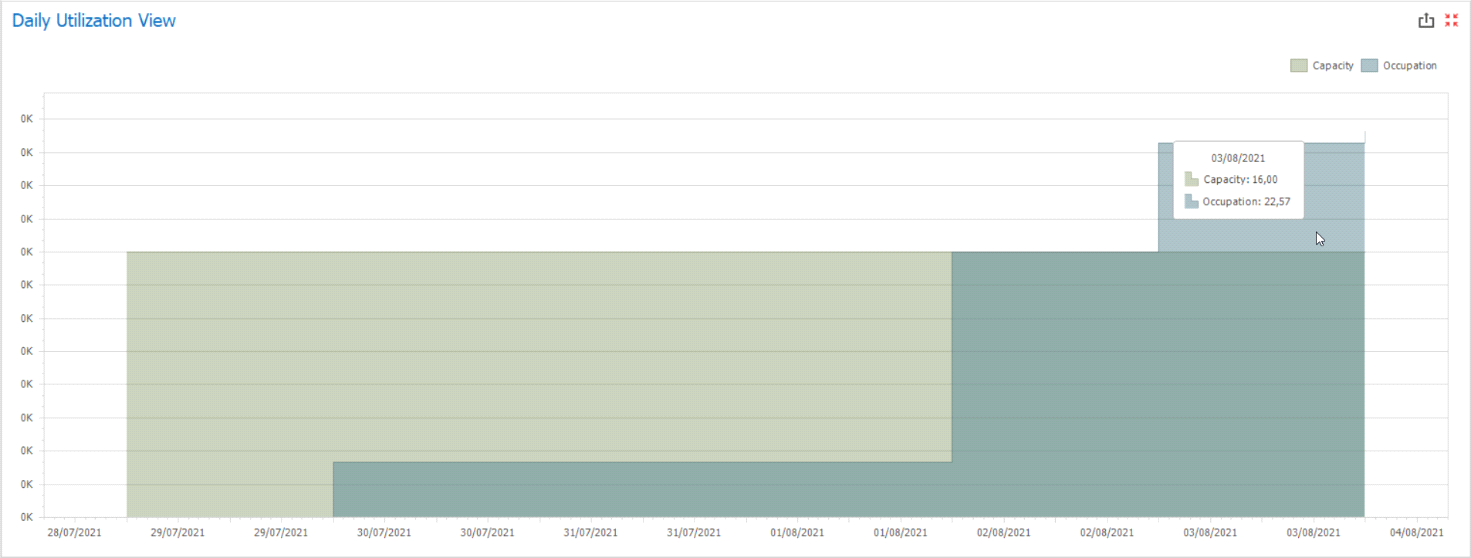
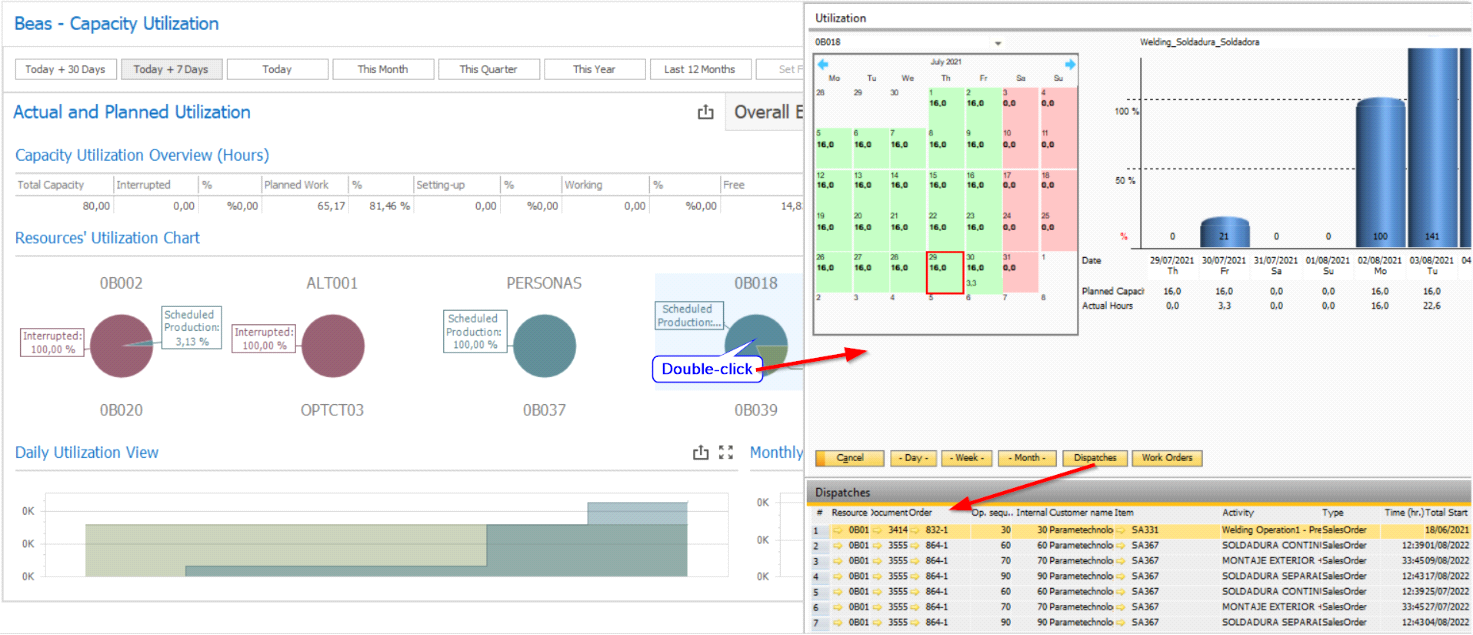
Then, if you wish to understand how the utilization evolves on each day of the week or of the month, you can either check the Daily Utilization View chart, or double-click the resource to trigger a B1UP Universal Function embedded into the dashboard for automatically opening the Beas Graphic Display Utilization function. If you wish to activate this feature, which also allows you to navigate into the resources’ dispatches and view the scheduled work orders, you must download the UF and import it into B1UP. DOWNLOAD: Right-click on the link DASH-CAP-CAPACITY and Save the xml file.
When choosing a time range that covers several months, it is also possible to understand how the capacity of a single resource was used across the different months by clicking on the resource and checking the results under the “Monthly Utilization View” chart.
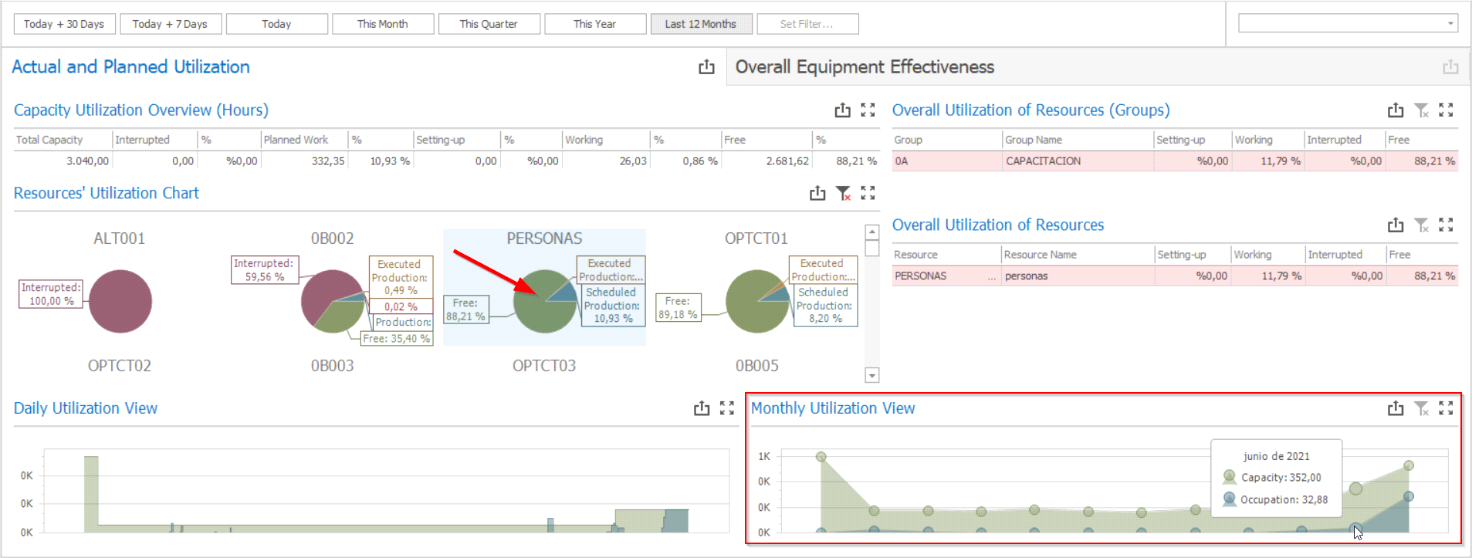
Important: For both “Daily Utilization View” and “Monthly Utilization View” charts, occupation will be expressed in terms of the executed and scheduled production. Interruptions and setup times will not be part of the occupation calculation.