The Capacity Utilization dashboard contains a series of analytical views to achieve a deep understanding about how the company’s production capacity is being utilized and how productive manufacturing resources are, considering different kinds of losses that might affect availability and productivity.
This dashboard contains two tabs:
Actual and Planned Utilization Tab
Overall Equipment Effectiveness (OEE) Tab
The data can be filtered using the pre-made filters for defined time ranges (today + 30 days, today + 7 days, today, this month, this quarter, this year, and last 12 months). Manual filtering can be done by clicking on “Set Filter…”. For performance reasons, this dashboard will load data from the current and from the previous year only.
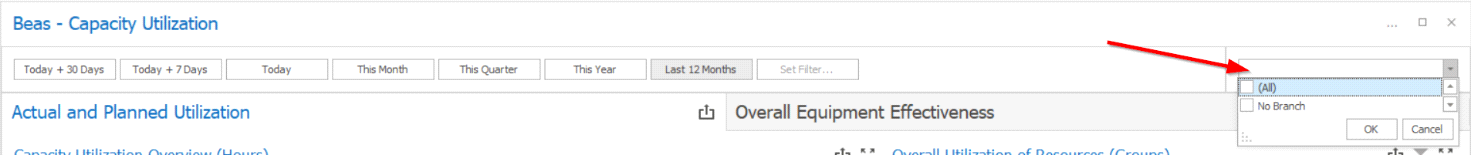
When using this dashboard on multibranch databases, the desired branches can be selected using the filter on the upper right corner of the dashboard. If there is no branch created for the databases, “No Branch” will be the only available option.