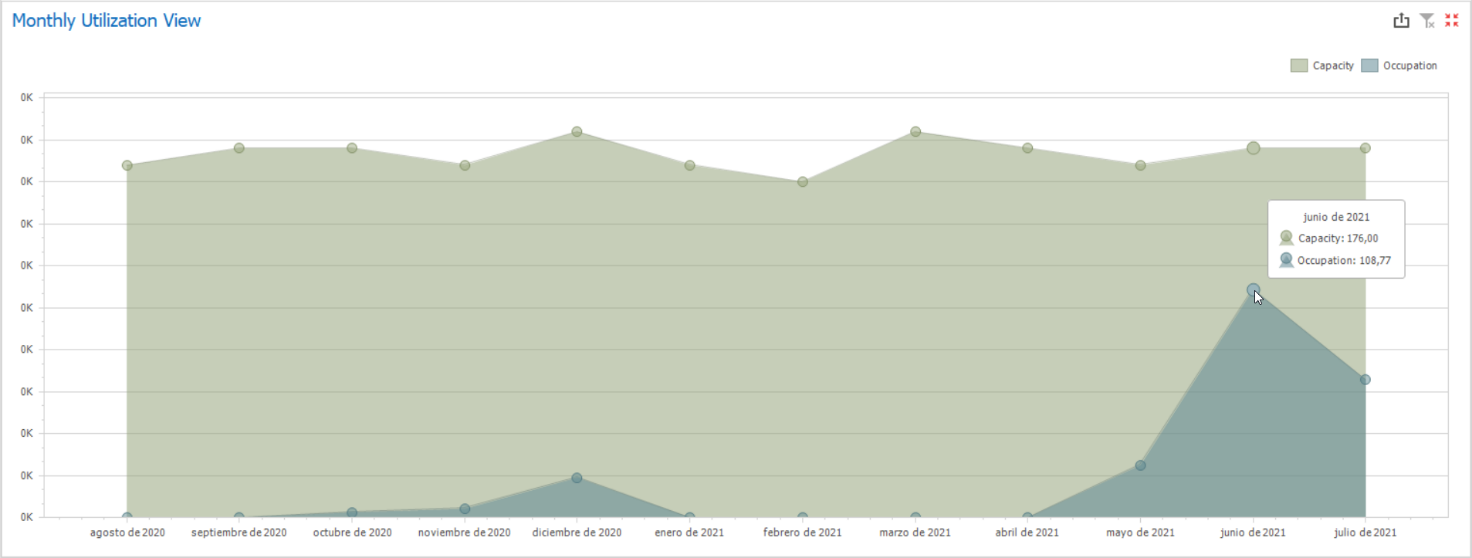
This chart combines two information in a single area with different colors, displaying the resources’ capacities and occupations for each month (occupation = scheduled work + executed work, setups and interruptions are not considered as occupation). The Monthly Utilization View will always present a summarized analysis for the selected filters, giving you the possibility to view capacity and occupation across the entire factory, for entire resource groups, or for single resources.
Any month can be selected for further insights on how the capacities are or were used, triggering filters on the other grids and charts from the dashboard.