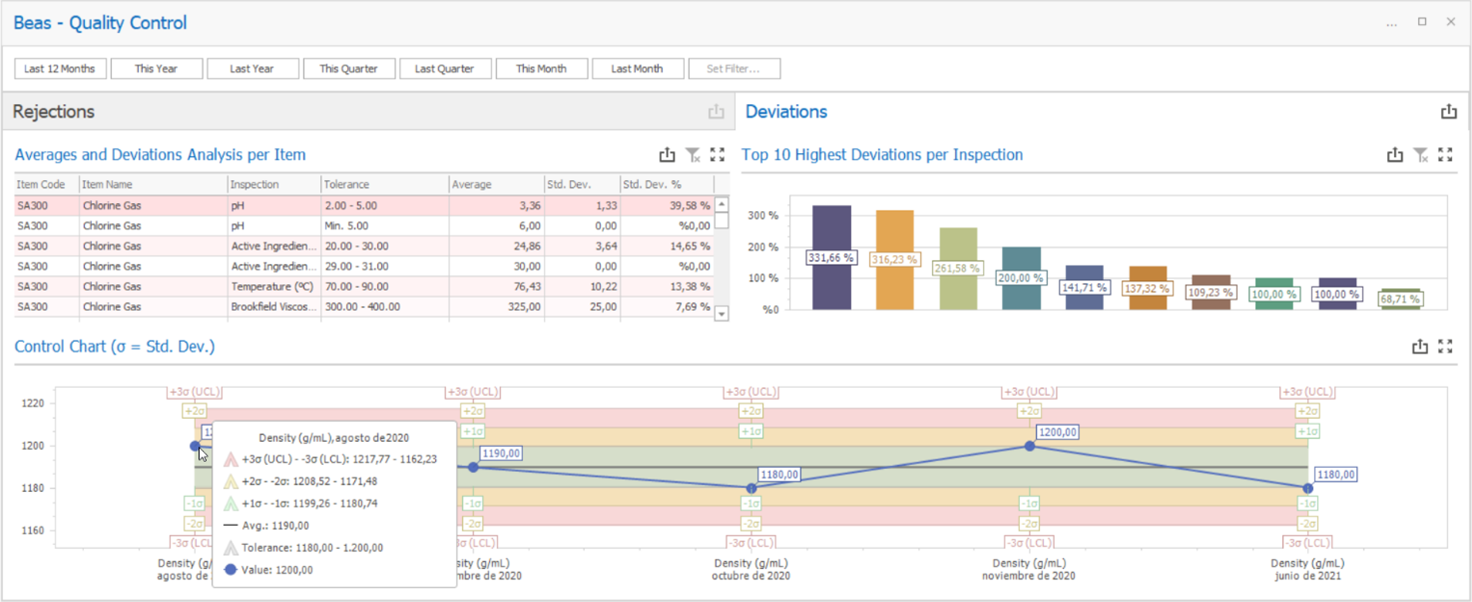
The Deviations tab displays the calculated averages and standard deviations for every inspection type related to all the inspected items, as well as a chart to understand the top 10 inspection types responsible for generating the highest deviations, and a control chart, a Statistical Process Control (SPC) tool for Six Sigma initiatives, for monitoring how the deviations of each inspection type are evolving over time. Additionally, the Deviations tab interacts with the Rejections tab, meaning that any filters or selections applied on Deviations also filter the data under the Rejections tab.
Dashboard sections:
Averages and Deviations Analysis per Item
Top 10 Highest Deviations per Inspection
Control Chart (sigma = Std. Dev.)