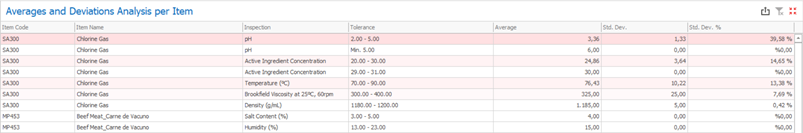
The Averages and Deviations Analysis per Item grid presents a detailed analysis over the inspections’ measured averages and standard deviations, allowing you to effectively monitor deviations in quality control and how the averages are positioned within the inspections’ tolerances. To allow a correct standard deviation calculation, the subjective inspections (OK or Not OK) are interpreted as numbers (1 for OK and 0 for Not OK) but identified as subjective on the tolerance (written as “OK - Not OK”).
The last column of this report will indicate the representativeness of the standard deviations over the measured averages, enabling you to easily identify big or small deviations. The rows will also be colored on a red scale according to the standard deviation representativeness.
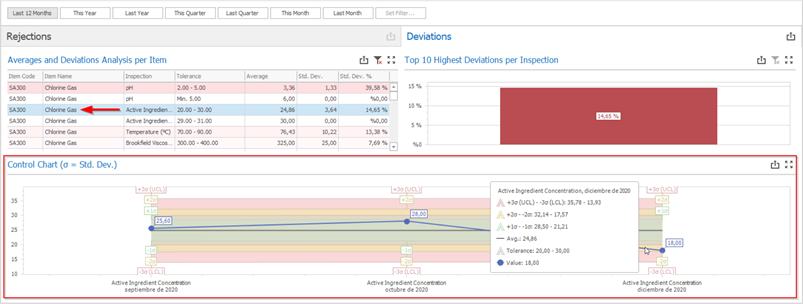
If you wish to check how the deviations of a particular item and inspection type are evolving over time in a control chart, you just need to click over the desired item and inspection type and check the results under Control Chart (sigma = Std. Dev.).
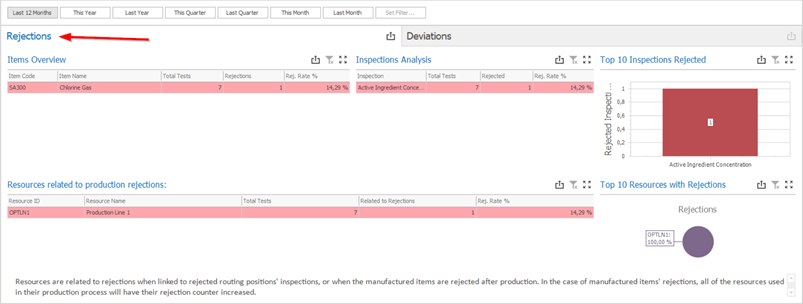
Additionally, if you want to check for rejections associated to the selected item and inspection, you can also check the results under the Rejections tab.