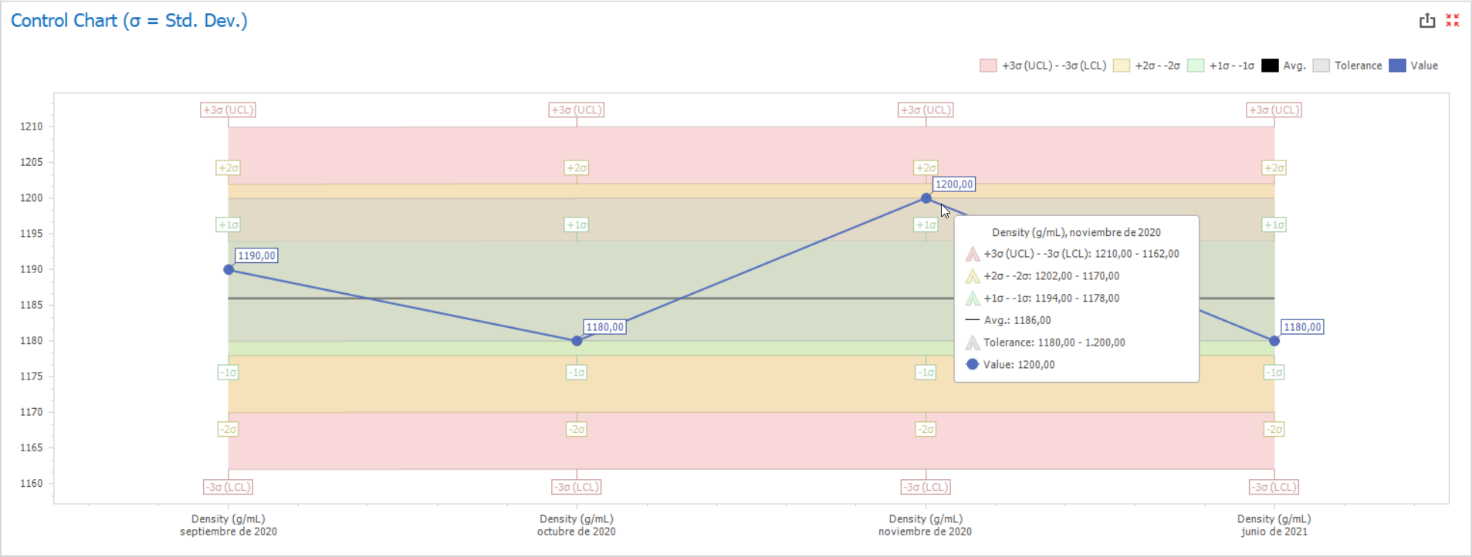
This chart places the monthly averages for each inspection type within control tiers, down to the Lower Control Limit (LCL) and up to the Upper Control Limit (UCL). On the center of the chart, the Center Line will represent the global average across all months (within the selected time range) for each inspection type, calculating the control tiers according to the global standard deviation:
+3σσ (UCL): Global average plus three times the standard deviation (Upper Control Limit);
+2σσ: Global average plus two times the standard deviation;
+1σσ: Global average plus one time the standard deviation;
Avg.: Global average only;
-1σσ: Global average less one time the standard deviation;
-2σσ: Global average less two times the standard deviation;
-3σσ (LCL): Global average less three times the standard deviation (Lower Control Limit).