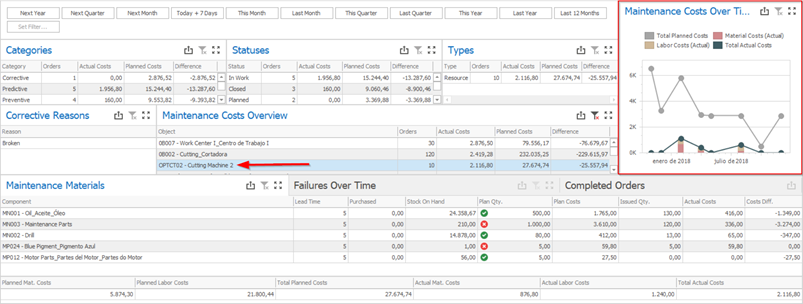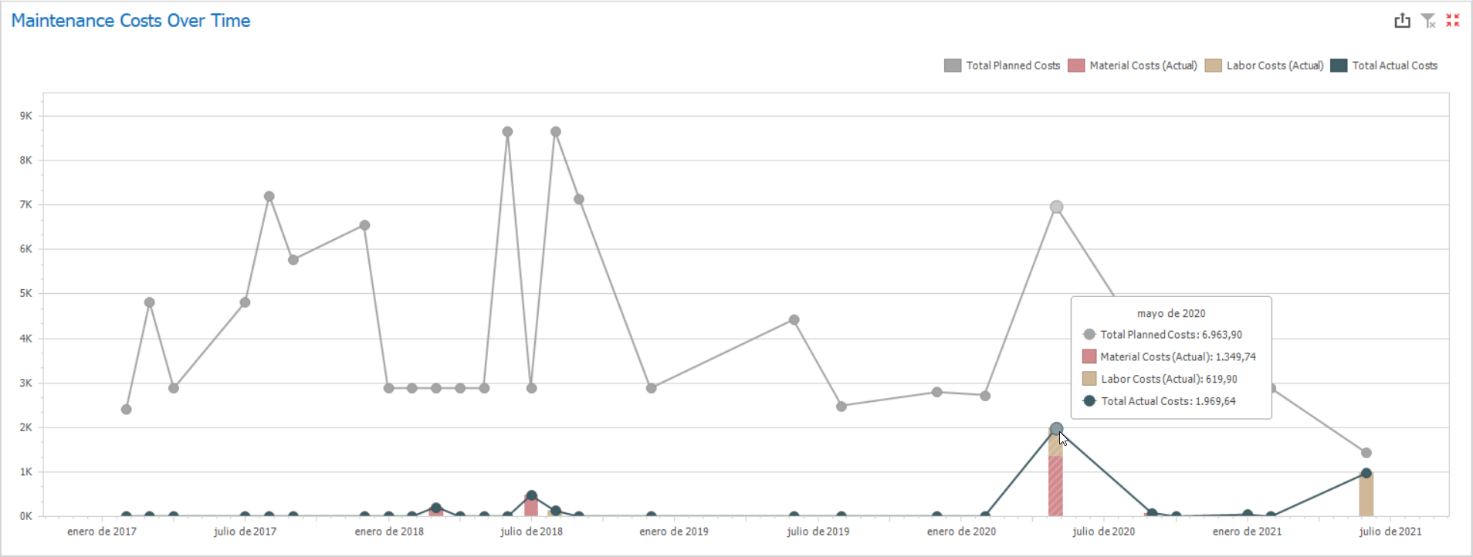
This chart shows how the planned and actual maintenance costs are evolving over time, breaking down the actual costs into material and labor (including both internal labor–calculated from full costs rates– and external services). The chart will reflect the current selections of the dashboard; for example, to check the planned and actual costs for corrective maintenances, you can select the “Corrective” category and see the results on the “Maintenance Costs Over Time” chart.
The same can be done for checking costs related to a specific equipment. To break down the planned and actual costs related to all maintenance orders created for the machine “OPTCT02”, you can select it on the “Maintenance Costs Overview” report and see the results on the “Maintenance Costs Over Time” chart.