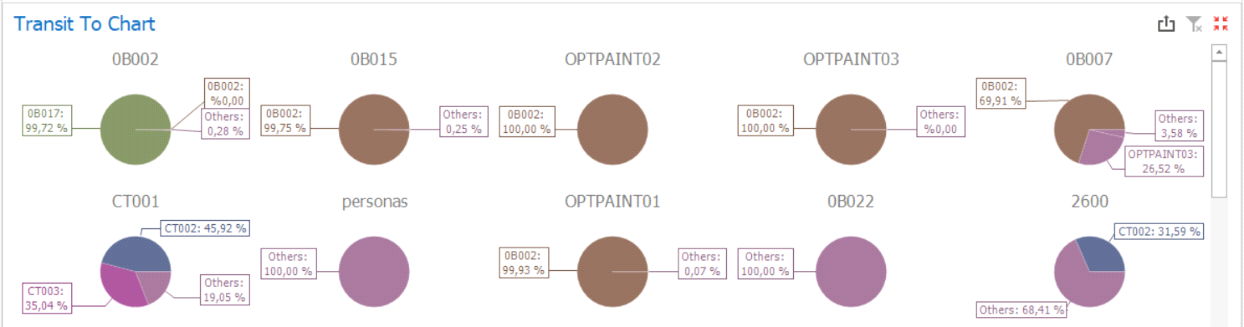
This chart is displayed as individual pies all resources from the “Transit From” grid and detail in slices how their transit times were distributed into the resources listed in the “Transit To” grid.
Transit To ChartBeas dashboards > Using the dashboards > Production Analysis > Transit Times Tab > Transit To Chart |
Top
Previous
Next
|
|
This chart is displayed as individual pies all resources from the “Transit From” grid and detail in slices how their transit times were distributed into the resources listed in the “Transit To” grid. |