|
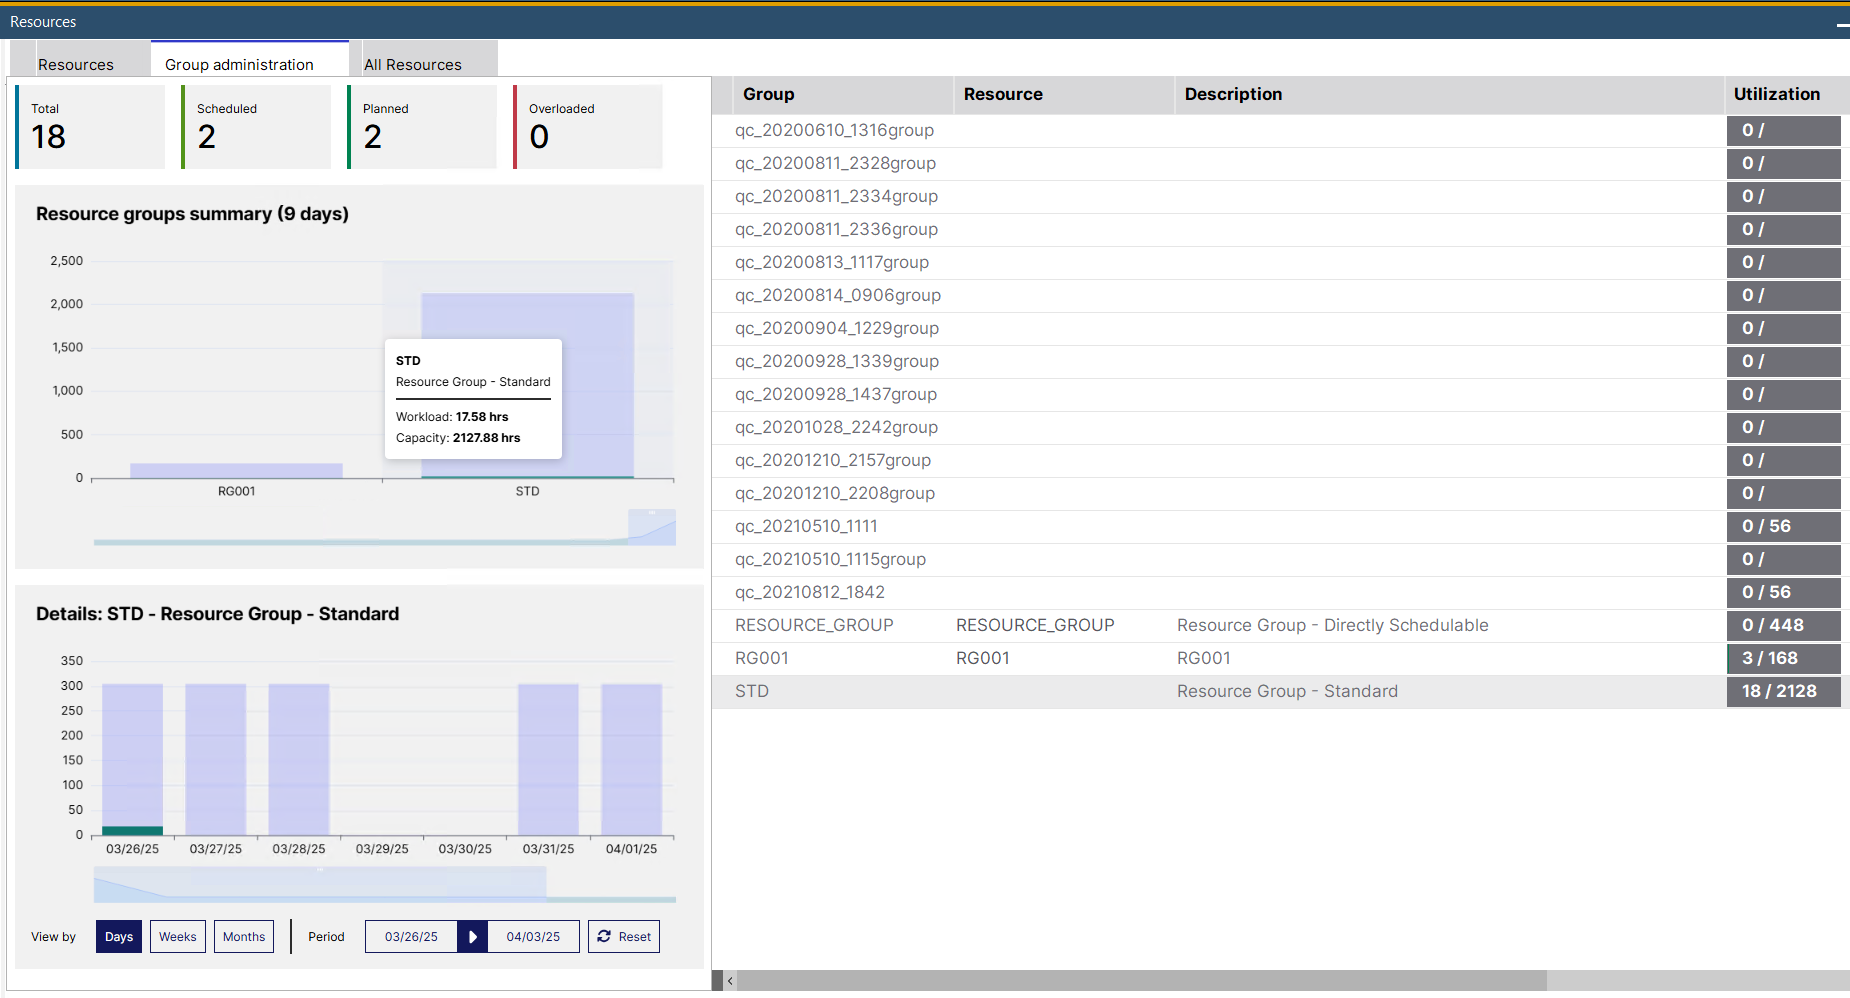
All existing resources groups are displayed with their current utilization.
Select a group and right-click the Open button to open, or the Add button to create a resource group.
PATH: Production > Resources
Window stamm_arbplatzgruppe_browse2.psr
Columns
|
|
|
Group
|
Name of the resource group.
|
Resource
|
Displays the linked group resource used for scheduling the group.
|
Description
|
Description.
|
Utilization
|
Current utilization of the resource group.
|
Udf1–4
|
User definable fields.
|
Graphical display
The graphical display provides a summary of all Resource utilization and the relevant details of a selected resource in a chart view.
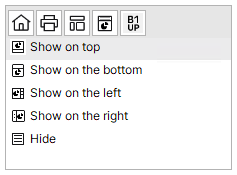
You can dynamically set the window structure of your preference by selecting the placement of the graphical display in the contextual menu. The appearance is user-dependent and can be set in each screen individually.
Adjust display size by Ctrl + Scroll up/down.
Graphical Contextual menu
Menu entry
|
Description
|
Show on top
|
Places the graphical display on the top of the window.
|
Show on bottom
|
Places the graphical display at the bottom of the window.
|
Show on the left
|
Places the graphical display on the left side of the window.
|
Show on the right
|
Places the graphical display on the right side of the window.
|
Hide
|
Hides the graphical display.
|
|
Color codes
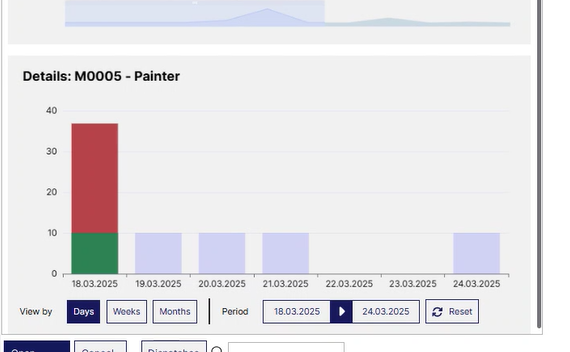
Light blue: unused, planned capacity on a specific date
Green: workload
Red: Overloaded capacity - number of hours over the planned capacity
|
Resource groups summary (XXX days)
|
Details: XXX Resource Group...
|
Utilization hours / Resource Group
The title of the graph (XXX days) indicates the number of days set as dispatching index for the Resources.
The graphics display the hours of utilization per resource groups.
Controls
|
Description
|
Total
|
The total number of resource groups. Click on it to see the visualization in the "Resources groups summary" graph.
|
Scheduled
|
The number of resource groups scheduled in work orders.
|
Planned
|
The number of resource groups used in production.
|
Overloaded
|
When the "Workload" exceeds the dispatching index of a resource, the system indicates this with a red "Overloaded" note (see image above).
|
Slider bar
|
Move the slider bar under the graph to show more/fewer resource columns.
|
Right-click menu
|
- Open resource group: Open the Resource group master data of the selected resource group.
|
When hovering over a column in the chart, a tool tip is displayed (see image above) with all resource group utilization information in hours.
Tool tip entry
|
Description
|
*Name of Resource*
|
The name of the viewed resource group
|
Description
|
Description of the resource group
|
|
Overloaded
|
When the "Workload" exceeds the dispatching indexof a resource group, the system indicates this with a red "Overloaded" note (see image above).
|
Workload
|
Scheduled hours for the selected resource group.
|
Capacity
|
The available capacity of the selected resource group in hours.
|
|
|
Workload / Time
This graphics section displays the capacity and workload (number of hours on the "Y" axis) of one, selected resource group under a defined time range ("X" axis). You can select a resource group to be viewed here for a period in the numbered list or by clicking on it in the "Resource groups summary" chart.
Tool tip entry
|
Description
|
Date / Week 01-52 / Month 01-12
|
The date / Time range being viewed.
|
|
Overloaded
|
When the "Workload" exceeds the dispatching index of a resource, the system indicates this with a red "Overloaded" note (see image above).
|
Workload
|
Scheduled hours for the selected resource.
|
Capacity
|
The available capacity of the selected resource in hours.
|
|
Control
|
Description
|
View by
|
Days / Weeks / Months
|
Select the unit of time range to view utilization details of the resource group.
|
Period
|
Select a start- and end date for the period that you wish to view.
|
Reset
|
Click this button to set the viewing period to the default starting date: today
|
Slider bar
|
The slider bar below the X axis shows the total time of the selected period to refine/re-adjust time selection or easily jump to any part of a longer period.
|
|
|
back to Resources
Help URL: https://help.beascloud.com/beas202506/index.html?ressourcen_gruppenverwaltung.htm
|