A production order is displayed in the graphical view from left to right.
You can switch to the "Boyum new Style" view in the View settings.
IMPORTANT: To use the Gantt graphical display for APS scheduling, you must also install the 32-bit version of Beas Manufacturing, as this third-party provider does not support 64-bit version software products.
The production order receives a totals bar (first gray bar at the top edge).
The individual assemblies in turn have their own bar (bar below this).
The individual work sequences are linked together by an arrow and represent the processing sequence in the time chart.
The delivery date is indicated by a red dot.
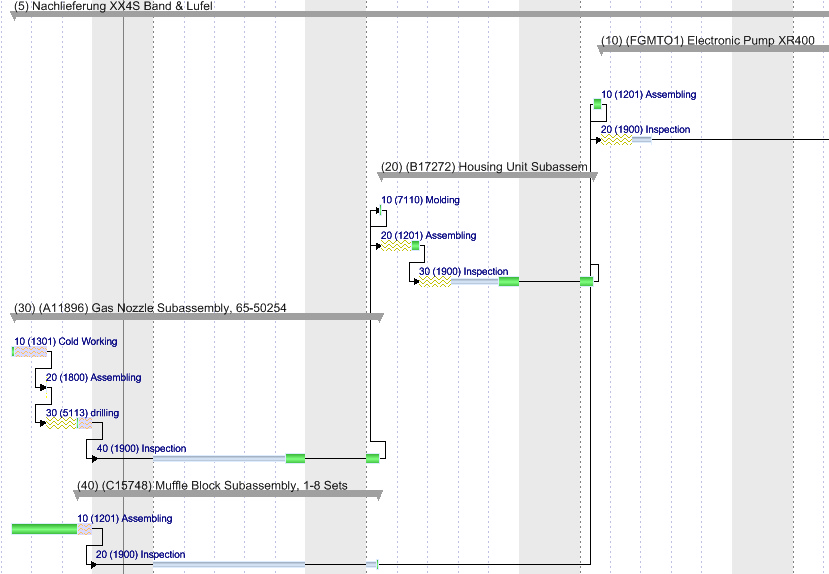
Example: Throughput of a production order
Structure of a work sequence
The timeline of a work sequence is subdivided into three parts:
1. Transfer time, which is stored in days in the resource
2. The job time, based on set-up time and job time x number of units as per work sequence
3. The idle time as per work sequence.
In the graphical view, there are other symbols or color displays that indicate e.g. the status of the production order.
|
External operation (orange background). |
|---|---|
|
Normal operation consisting of transfer time, setup + processing time (green range) and idle time. |
|
Work sequence currently logged in. |
|
There has already been a partial login to this work sequence. |
|
Normal work sequence, position has already been printed. |
|
Parallel resource. |
|
Resource of type Tool. |
|
Production order is marked as "Planned". |
|
Work order is planned by APS. |
|
Delivery date. |
|
Delivery date cannot be met. |
|
Work sequence is fixed to a deadline. This is considered in forward scheduling. |
|
Marked work sequence. In the event of rescheduling, all production orders in which a work sequence is marked are recalculated. |
|
Overlapping: The following work sequence was fixed and its start is BEFORE THE END of the previous work sequence. In this case, red shading is applied. |
Icon changes:
Green/Red flag: Within/past the delivery date.
Icons and colors - OLD style |
Description |
Icons and colors - "Boyum new Style" |
|---|---|---|
|
Time cut |
|
|
External operation |
RGB(93,93,93)
|
|
Delivery date. When delivery date has passed, the color changes to red. |
|
|
Tool resource |
RGB(52,98,108)
|
|
Transit time
|
RGB(128,139,159)
|
|
Resource start-end |
RGB(20,39,78)
|
|
Work order |
|
|
Idle time |
RGB(221,221,221)
|
|
Parallel |
RGB(163,210,202)
|
|
Resource Start-end |
|
|
Finished work order |
|
|
Not available material |
|
|
Material is available |
|
|
End of the operation |
|
|
Marker function to perform action on an operation. |
|
|
Fixtime |
|
Alternative resource |
RGB(94,170,168)
|


