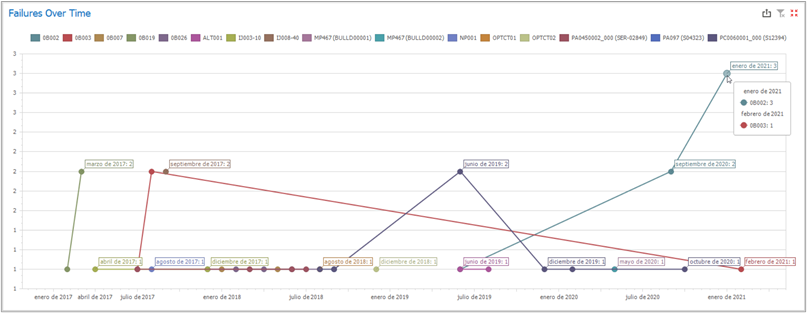
This chart presents all corrective maintenance orders created for the different equipment on a timeline. The data on the chart reflect the values selected on the other reports of the dashboard. Therefore, if you select “Tool” on the types list, the “Failures Over Time” chart will show a timeline of all corrective maintenances performed for the company’s tools. Additionally, if you want to see the pattern of failures on a timeline for one single equipment, you can select it on the “Maintenance Costs Overview” list and see the results on the “Failures Over Time” chart.
Important: The chart only reflects corrective maintenance orders, not other categories of maintenance orders. Each month displayed on the chart can be selected for filtering the dashboard’s data. If, when analyzing the chart, you identify a month with an exceptionally high number of maintenances and wish to know which equipment failed in that month, you can just select it and see the results in “Maintenance Costs Overview”.