Single time reservations of a resource are displayed, grouped by day. In contrast to the dispatches window, not only start/end end time, but also all interruptions are displayed. (a reason may be a reservation over several days, or a dispatch optimized for lead time). Other fields are available in Window settings.
Window stamm_arbplatz_einlastungen_extra.psr
Field |
Meaning |
Document |
General definition of resource. |
Order |
Work order number. |
Position |
Position in document. |
Op. Sequ. |
Operation position. |
Resource |
Resource ID. |
From |
Start time. |
To |
End time. |
Time hrs |
Duration. |
Item |
Item number. |
Designation |
Item designation. |
Quantity |
Quantity to be produced. |
I-Version |
Item version. |
Drawing number |
Drawing number. |
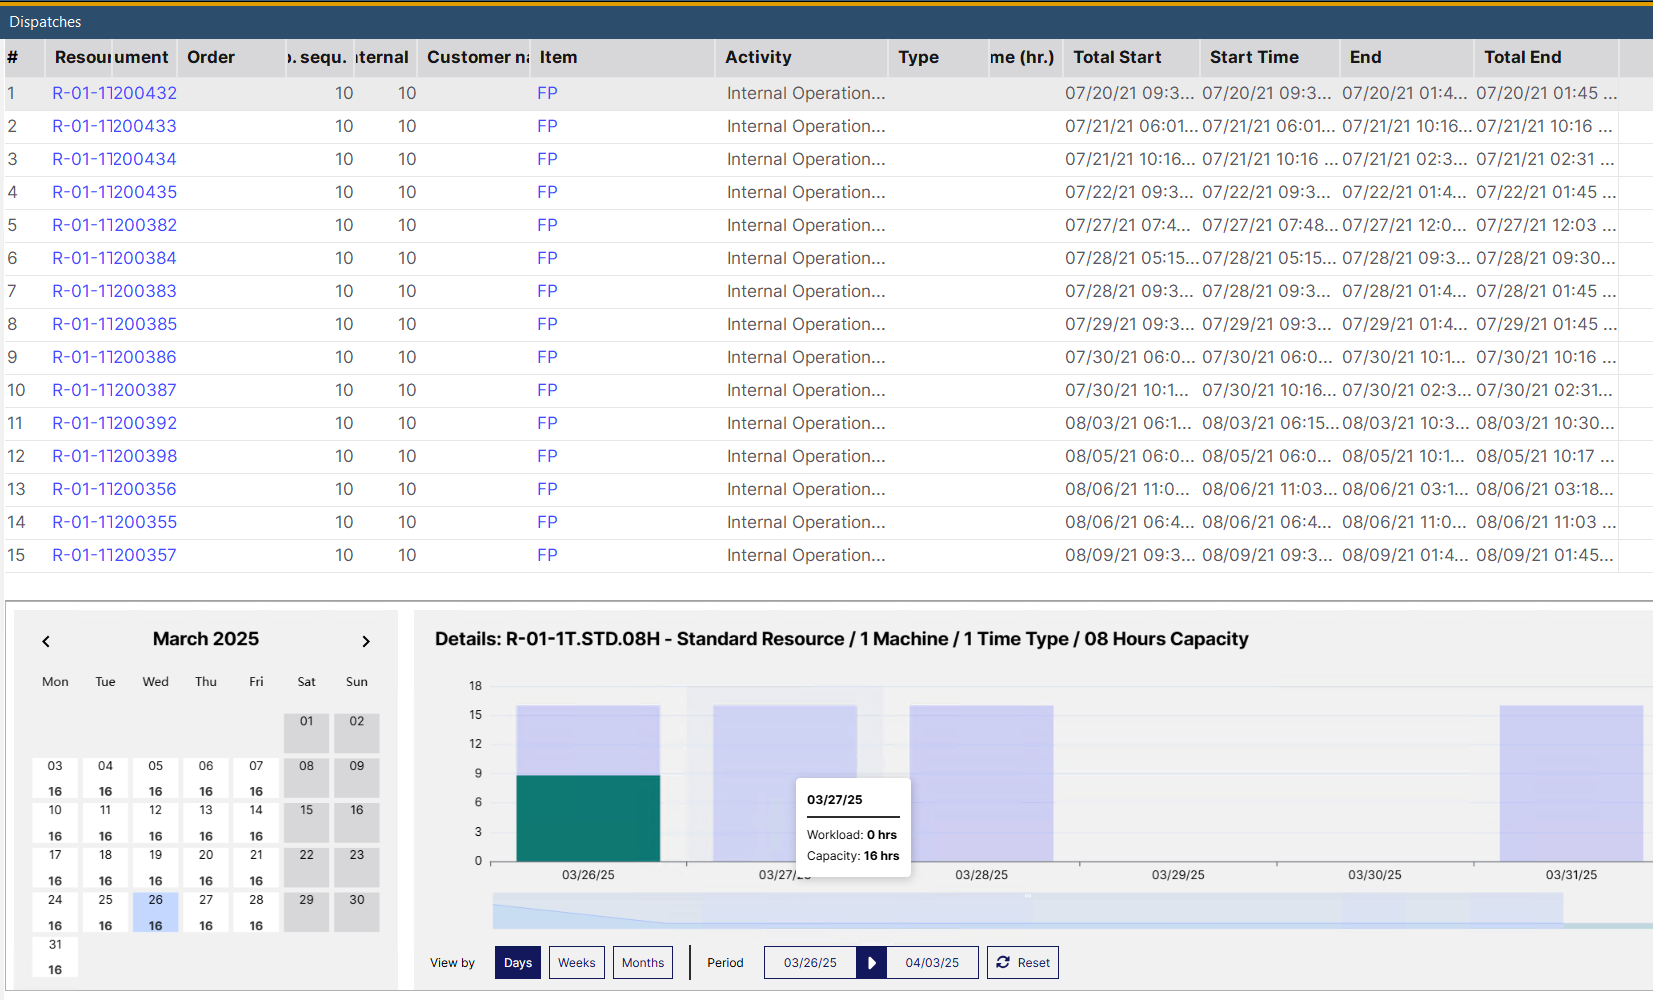
Graphical display
The graphical display provides a summary of all Resource utilization and the relevant details of a selected resource in a chart view.
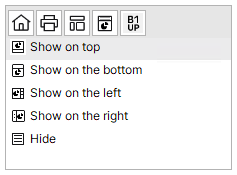
You can dynamically set the window structure of your preference by selecting the placement of the graphical display in the contextual menu. The appearance is user-dependent and can be set in each screen individually.
Adjust display size by Ctrl + Scroll up/down.
Select resource or resource group from the list to be displayed. |
Graphical Contextual menu
|
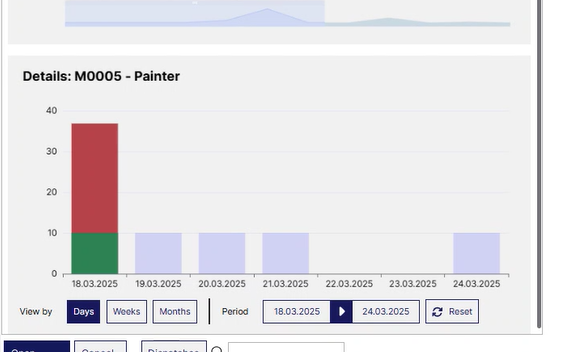
Color codes
Light blue: unused, planned capacity on a specific date Green: workload Red: Overloaded capacity - number of hours over the planned capacity |
Select a day in the calendar view and it visualizes the details of resource utilization (hours/period) in the "Details" graph.
Month - Year (Calendar view) |
Details: Resource XXX |
||||||||||||||||||||||||||||||||||||
|---|---|---|---|---|---|---|---|---|---|---|---|---|---|---|---|---|---|---|---|---|---|---|---|---|---|---|---|---|---|---|---|---|---|---|---|---|---|
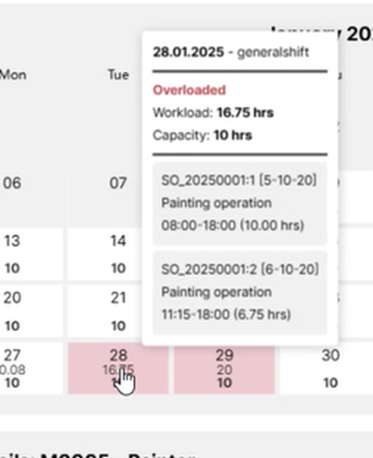
The calendar visualization provides a monthly overview at resource utilization. The number of resource capacity hours are indicated under the date numbers. Color codes and tool tips assist usability.
Color codes of calendar days:
•Grey: Non-labor day (no capacity or holiday) •Red: Day with overloaded capacity •White: Any day with capacity planning •Blue: the currently selected day
Hovering over a calendar day shows a tool tip on the relevant details of resource utilization:
Tool tips
Controls: Left-right arrows to navigate between calendar months. |
Shows the utilization information of a resource on a specific day / period.
|
||||||||||||||||||||||||||||||||||||
back to Dispatches