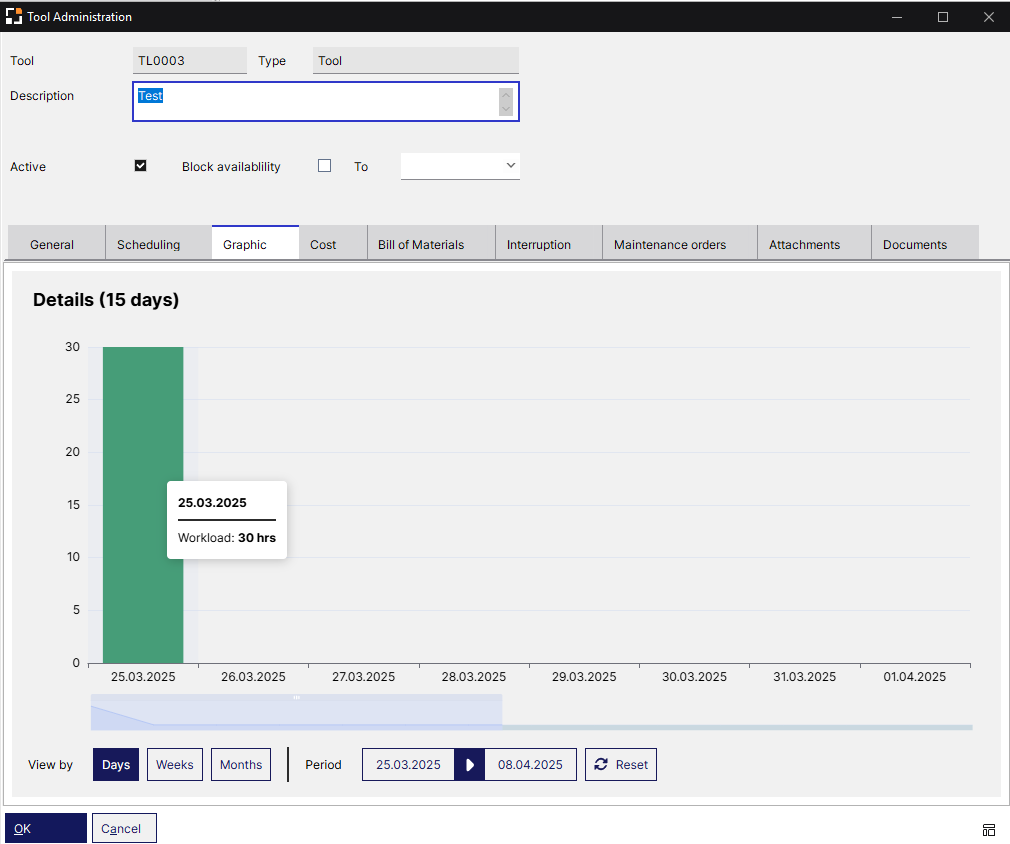
This tab provides a graphic demonstration of tool usage per days/weeks/months and percentage.
It shows the workload of the selected tool detailed in a specific period of time.
Note: Only available for tools with Capacity planning.
Window stamm_wkz_edit.psr