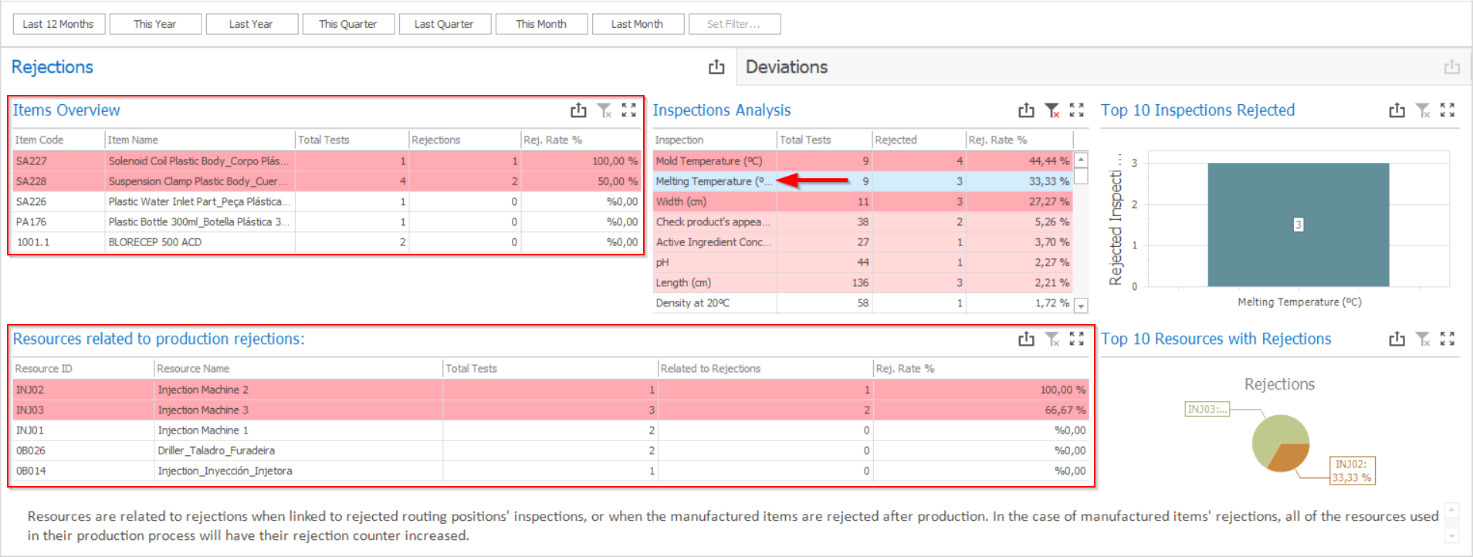
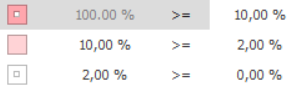
This grid shows all the different types of inspections performed in quality control analyses, including the total number of tests, the number of rejected inspections, and their corresponding rejection rates. The rows are colored in a red scale to represent how large the quality rejection rates were:
If you want to know which items were rejected for a particular reason or which production resources were used for items related to that inspection type, you can just select the desired inspection and check the results under the Items Overview and Resources related to production rejections grids.