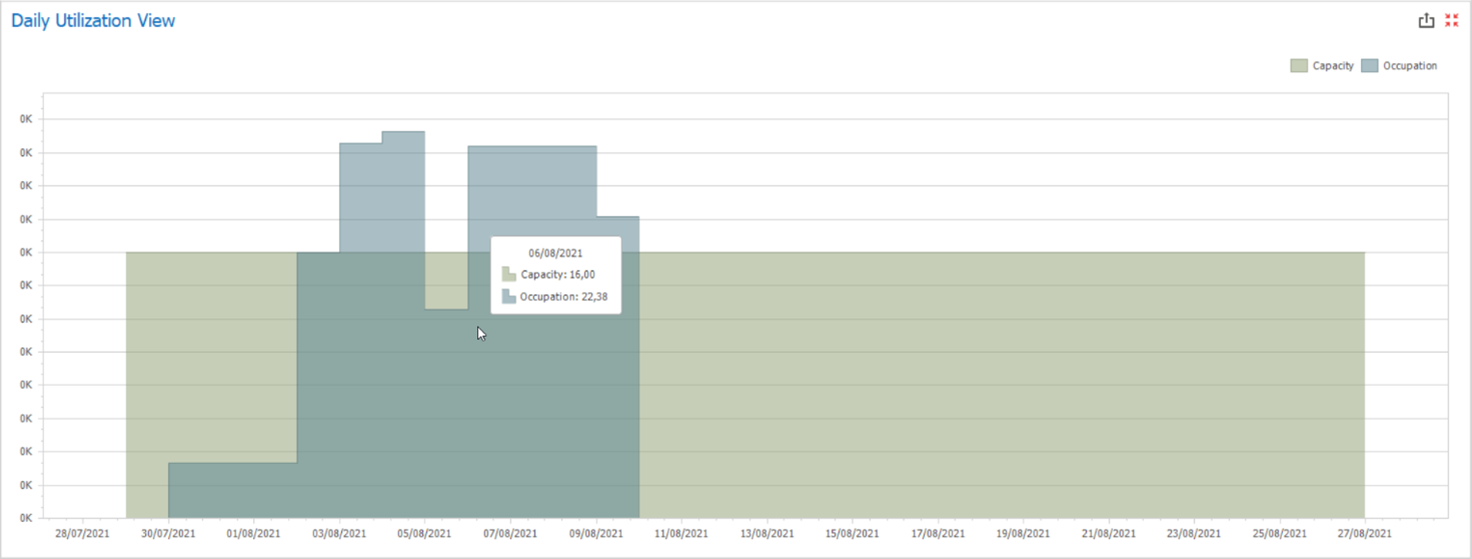
This chart combines two information in a single area with different colors, displaying the resources’ capacities and occupations for each day (occupation = scheduled work + executed work, setups and interruptions are not considered as occupation). The Daily Utilization View will always present a summarized analysis for the selected filters, giving you the possibility to view capacity and occupation across the entire factory, for entire resource groups, or for single resources.
Important: All days with zero capacity are ignored, to improve the chart’s visualization and the dashboard’s performance.