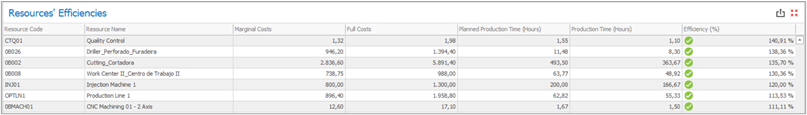
With this report, you can see the costs (marginal and full) registered for each resource in the selected time range, and compare the planned production times to actual production times. The report calculates the actual efficiency by dividing the planned production times for the actual production times. So, if an operation is planned to last 1 hour and is executed in 2 hours, the actual efficiency is of 50% (1h/2h).
By default, three icons can be presented by this report. The icons can be customized by editing the dashboard and defining new color rules.
![]() Efficiency greater than 70%
Efficiency greater than 70%
![]() Efficiency between 50% and 70%
Efficiency between 50% and 70%
![]() Efficiency lower than 50%
Efficiency lower than 50%