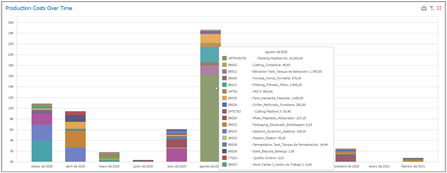
This chart displays the sum of full costs (from production time receipts) for each month in the selected time range, detailing how each resource participated in the costs’ composition. The “Production Costs Over Time” chart can also be used to filter the data on the “Resources’ Efficiencies” and “Scrap Rates” reports: when you click on any bar of the chart, the two reports are filtered to display only display for the selected month. This can come in handy if you want to see the detailed list of the resources and their costs, which will be displayed on the “Resources’ Efficiencies” report.
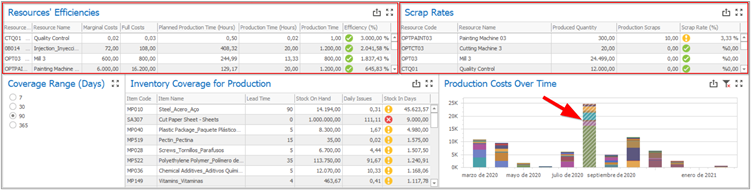
This selection, however, will not affect the “Inventory Coverage for Production” or “Production Profitability (Estimation)” reports.