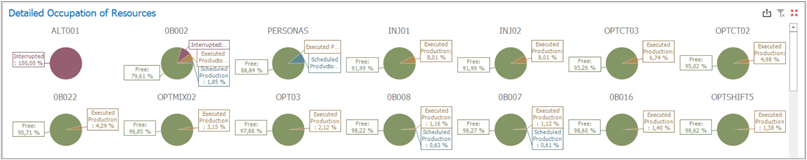
This pie chart shows how the capacities from each resource are used, slicing them into four parts (see detailed explanations under “3.1. Capacity Usage Overview (Hours)”):
a)Interrupted: Total interruption hours registered for the resource;
b)Scheduled Production: Total scheduled (and not executed) work hours for the resource;
c)Setting Up: Total setup times registered for the resource;
d)Executed Production: Total work hours registered for the resource;
e)Free: Remaining capacity after discounting interruptions, scheduled work, setup times, and work times.
The resources are displayed according to the applied filter. For example, if you wish to check how all the resources will be occupied in the next seven days, you just need to select “Next 7 Days” on the time range filters. Then, if you wish to filter further for specific resource groups or resources, you can select them on the corresponding charts. The same can be done for filtering specific months, using the “Capacity Usage Overview” chart.