- Display local and global initialized Beas - variables
- Display SAP Business One events
- Execute Beas - scripts
Overview Debug Functions
Send Debug Log to Support
Display field names
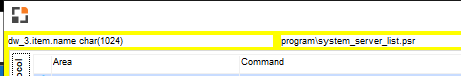
The system information is displayed in the first row of the debug window if a Beas-window is currently opened.
Information on the current field is displayed (where the mouse cursor is)
1. Form-Number (dw_1, dw_2, .. dw_6)
2. "item" - as note, if it is an item of a form
3. Field name
4. Field type
5. "Table:" + Table name, linked to the field
6. Form name. Generally a PSR-File + folder name
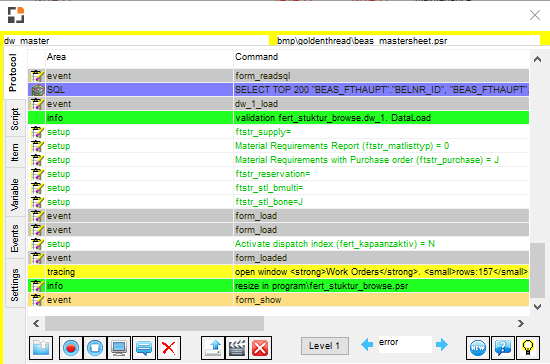
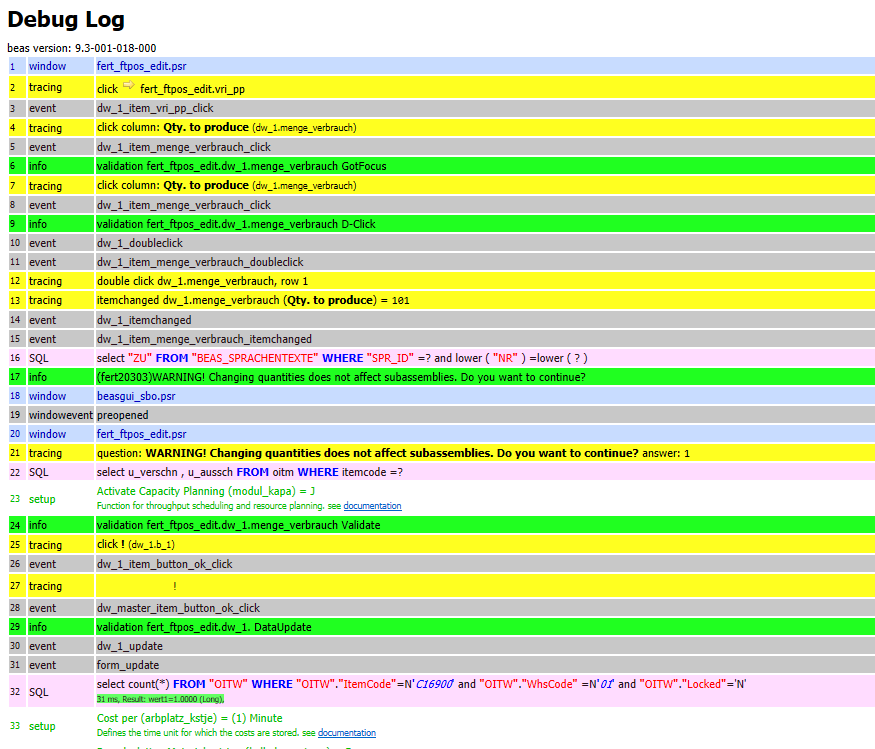
In the Debug window you can view and edit all current events, SQL statements or scripts. Events are displayed in separate rows and in different colors.
Events on Level 1 are displayed with a yellow border around the window (see image below) which changes to red once having switched to Level 2 and 3.
The color codes of the events are as follows:
Green: reading settings
Violet: calling functions
Orange: customized function
Red: error
Grey: window-specific event
PATH: View > System information or Ctrl+Shift+i
Click open a row to view the source code in an editor:
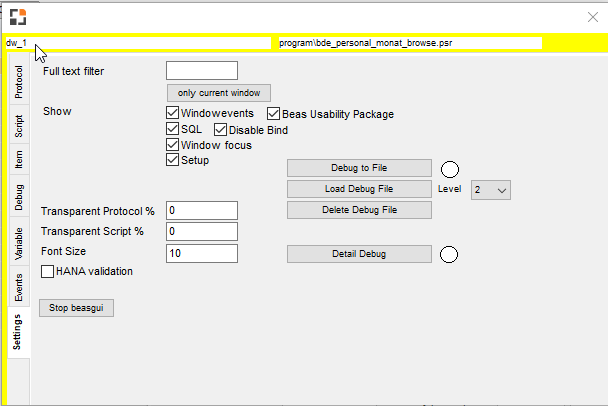
The debug log can log every executed SQL command, Script line, Setting Read/Changes and many more
The line of buttons located on the bottom of the window in the Protocol tab + their meaning:
Button below
Meaning
Show details for current line
Start debug log
Stop debug log
Create Printscreen of the current window
Insert comment in debug log
Delete current row
Upload and create URL string to clipboard. You can insert This URL string in your ticket or send it as a link in email and other messaging systems. SeeDebug log HTML string
It is possible to use the debug window when Beas entries are collected within a separate menu point in the Modules tab of the SAP B1 Main menu.
In this way you can get an HTML view of the debug log with images and get a clear understanding of the process.
To access debug information of a window, proceed as follows:
1. Click on the Printscreen button in the Protocol tab.
2. Mark a line and Shift + double-click on certain information you wish to edit.
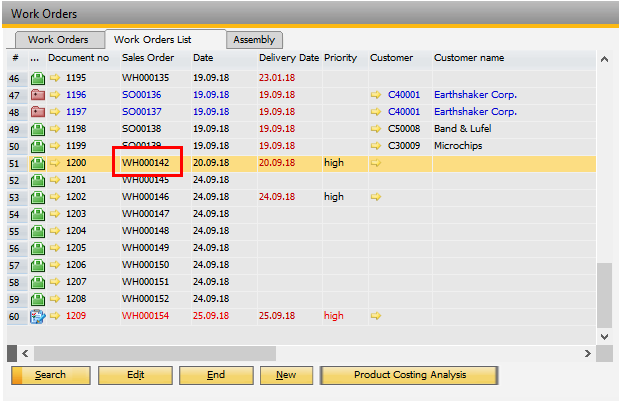
3. A red rectangle appears (see image below) which can be moved with the mouse.
4. Click the Printscreen button again to access the HTML view.
Window fert_fthaupt_browse.psr
Example:
1. Open work orders and follow the procedure above.
2. Double-click on a work order, change some of the information in the WO window, then click on the Printscreen button.
3. Repeat changing information in the WO data and click Printscreen after each change.
4. Click on to see the formatted HTML string of the process.
In this way you get a clearly understandable picture or description of an entire process in an HTML view.
The different colors help support agents to quickly analyze every click and setting performed in a chronological order in the log.
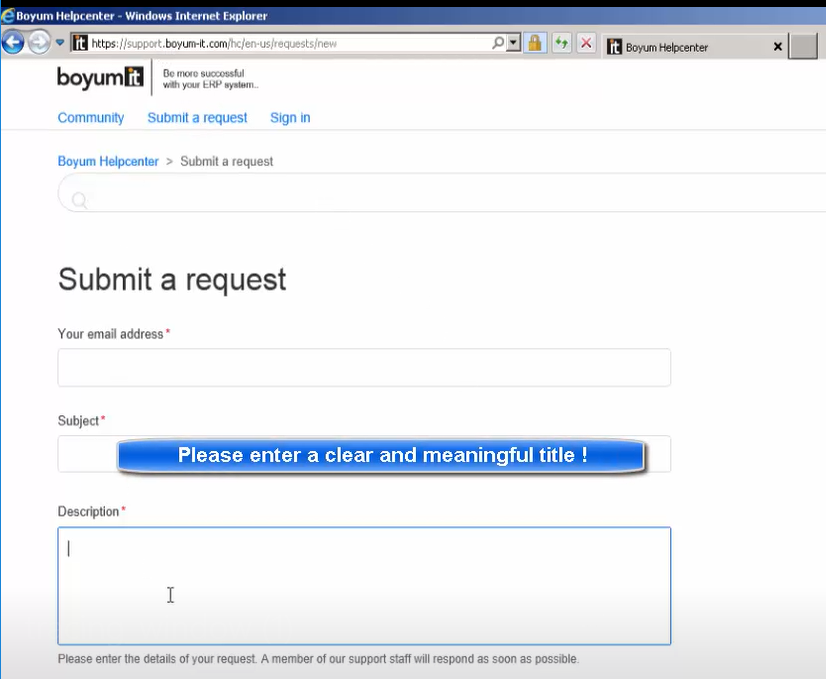
In case you need support, you can simply copy the URL address of the Debug log to the clipboard and paste it in the Boyum help page to submit a request.
The email address, the subject and a clear, detailed description of the issue are mandatory to add. First, paste the URL string of the Debug log and describe the issue in a simple way. Then, send your request to support.