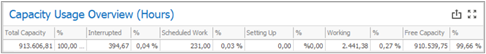
This single row report details the usage of the capacity for the selected parameters, combining the time range filter to the chosen resource groups or resources. For example, if you wish to understand how the total factory capacity was used in the last year, you could just select “Last Year” in the time ranges and this report will show the following information:
| a) | Total Capacity: Total capacity in hours, summing the capacities from all the resources; |
| b) | Interrupted: Total interruption hours registered for the resources. Interruptions can come from planned downtimes, like preventive maintenances, or unplanned downtimes, like broken machines. When an interruption is created without a planned end date, it might affect the resource’s capacity for a long period until it is ended; therefore, whenever the planned end date could be estimated, it is recommended to update the interruptions with the corresponding planned end dates; |
| c) | Scheduled Work: Total scheduled (and not executed) work hours for the resources (if the time range is in the past, like, for example, last year, having values on “Scheduled Work” means that there are open and overdue work orders with planned dates for the past); |
| d) | Setting Up: Total setup times registered for the resources (time receipts created for the “Setup” time type; if the “Setup” time type is not enabled for the resources, all times are registered and considered as production times); |
| e) | Working: Total work hours registered for the resources (time receipts created for all time types that are not “Setup”; if not using more than one time type, all times are considered as production times); |
| f) | Free Capacity: Remaining capacity after discounting interruptions, scheduled work, setup times, and work times. |
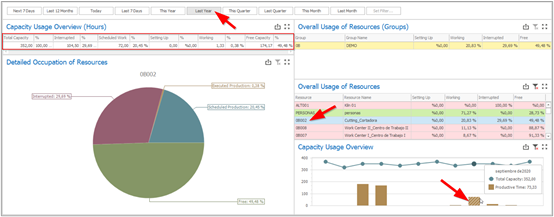
If you wish to check how the capacities of resources from a single resource group or even how the capacity of a single resource was used, you can just click on the resource group (report “Overall Usage of Resources (Groups)”) or on the resource (report “Overall Usage of Resources”) you wish to detail, and this report will display data exclusively for the selected resource or resource group. The same can be done if, inside a range of several months, you wish to see data from a single month; in this case, you can just click on the month you wish to detail on the chart “Capacity Usage Overview”.
For example, if you wish to understand how the capacity of the “0B002” resource was used in September of the last year, you can choose “Last Year” in the time range filters, click on the “0B002” resource, and click on the month of September.