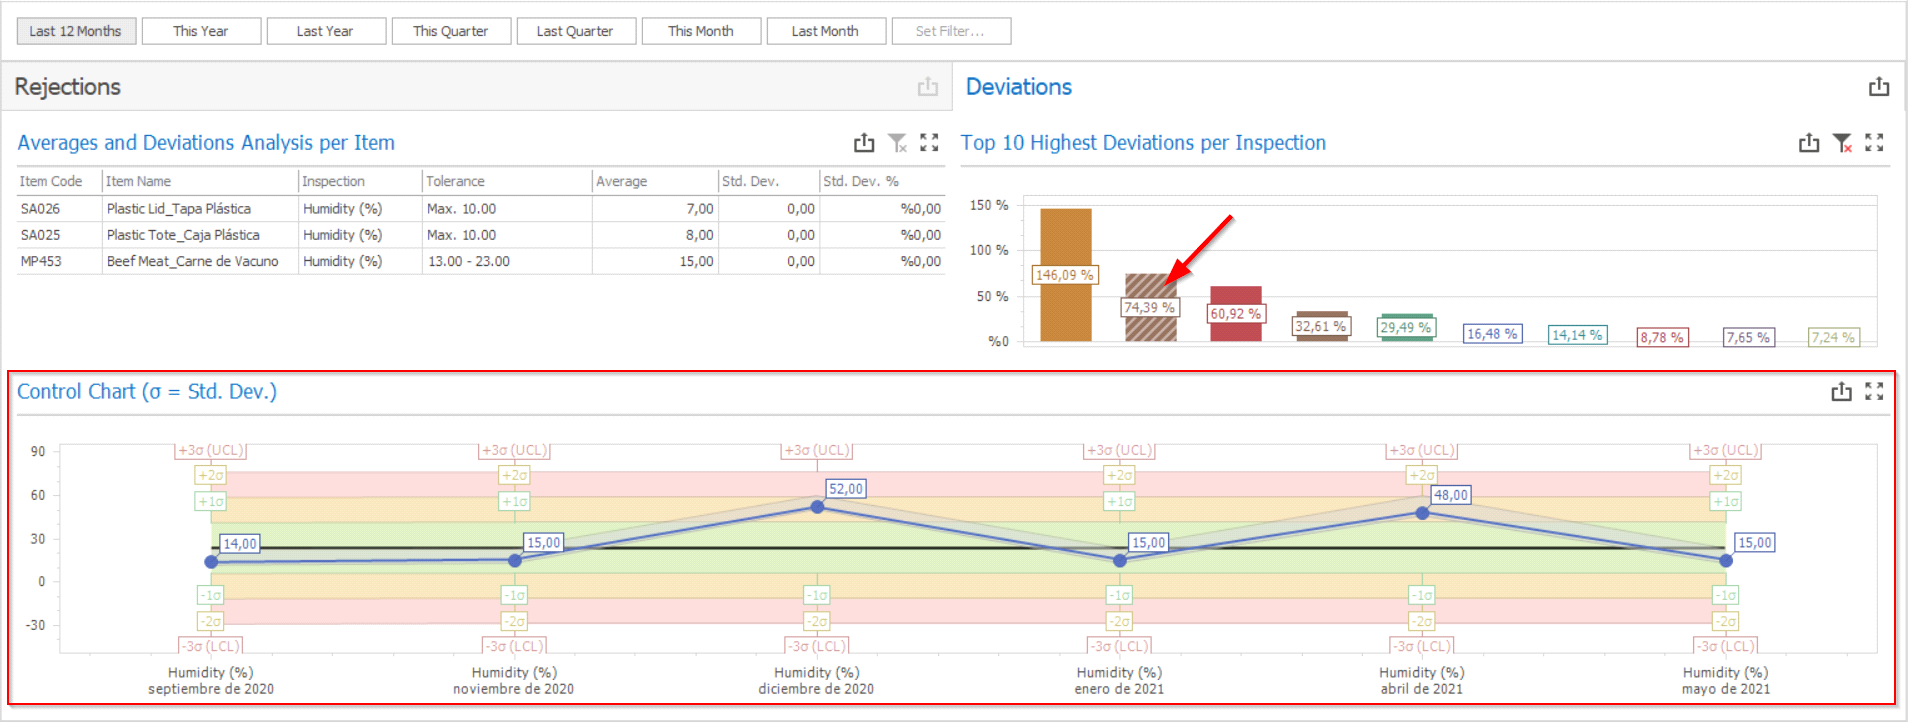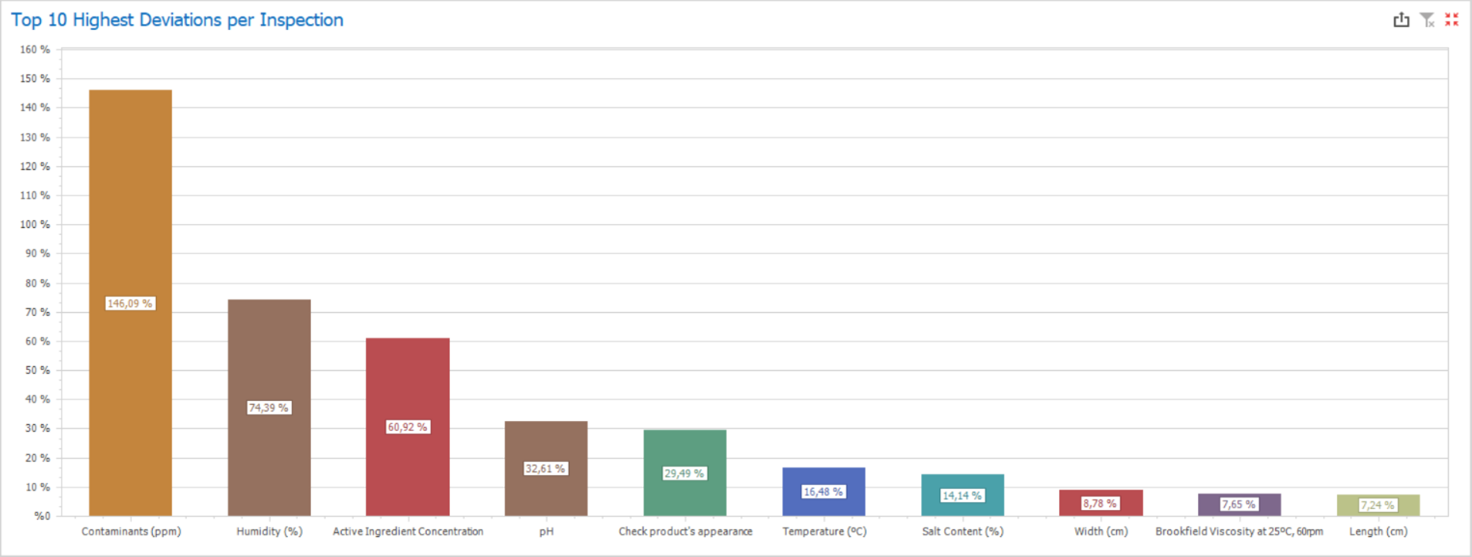
This chart presents a summary of the top 10 inspections with highest standard deviations on quality control, detailing the representativeness of the standard deviations over the measured averages (amongst all inspections performed for all the products – expect in cases in which you filter for a specific product).
Any inspection can be selected for further insights on which products were rejected or on the deviations registered for that specific inspection over time (triggering filters on the other reports and charts from the dashboard). For example, if you want to know how the deviations of “Humidity (%)” are evolving over time, you can just select it and see the results on the Control Chart (sigma = Std. Dev.) chart.