Usage rate
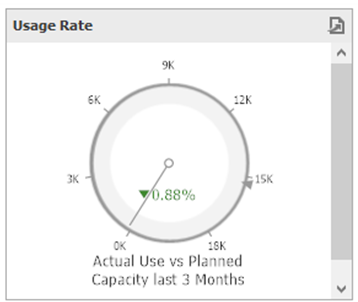
This gauge shows the percentage of the actual resource utilization from the planned capacity for all resources.
This indicator includes by default the last 3 months as the data range, active resources only with capacity planning and it excludes the resources set for service or cost.
Data Items used |
Description |
View/Table field |
Planned Capacity |
Sum of the hours for the planned capacity in the last 3 months. |
View: "BEASV_RESOURCE_UTILIZATION"."PlannedCapacity" |
Actual Use |
Sum of the hours for the actual use in the last 3 months. |
View: "BEASV_RESOURCE_UTILIZATION"."ActualUtilization" |
Planned usage rate for the next two weeks
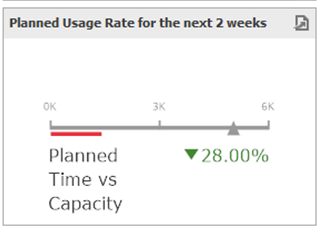
This linear gauge shows the percentage of the planned work time for the resources from their planned capacity.
This indicator includes by default the next 2 weeks as the data range, active resources only with capacity planning and it excludes the resources set for service or cost.
Data Items used |
Description |
View/Table field |
Reserved Time |
Total reserved working time for the resources in the next 2 weeks. |
View: BEASV_RESERVED_TIME.ReservedTime Date range: COALESCE((SELECT SUM(BEASV_RESERVED_TIME."ReservedTime") * 1.0 / 60.0 |
Planned capacity in the next two weeks |
Total hours of the planned capacity of the resources. |
COALESCE(SUM("PlannedCapacity"), 0) AS "PlannedCapacity" Next two weeks date range: WHERE (BEASV_RESOURCE_UTILIZATION."Date" <= ADD_DAYS(NOW(), 15)
It is possible to calculated a filed in the dashboard, instead of having the date range in the query: Sum(Iif(DateDiffDay([Date], Today()) <= 15 And [Date] > Today(), [PlannedCapacity], 0)) |
Resources Interruptions Rate
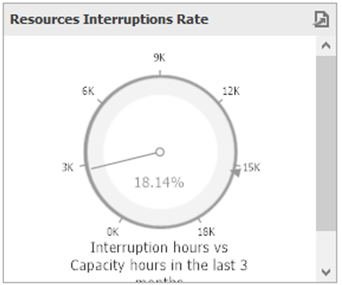
This gauge shows the percentage of interruption hours from the total capacity hours of all the resources.
This indicator includes by default the last 3 months as the data range, active resources only with capacity planning and it excludes the resources set for service or cost. Only interruptions with completed or active status are taken into consideration for this gauge.
Data Items used |
Description |
View/Table field |
Interruption duration |
Total interruption duration in hours. Only those hours are taken into account that interfered with the resource working schedule during the last 3 months. |
View: BEASV_RESOURCE_UTILIZATION."InterruptionDuration" |
Planned capacity |
Planned capacity hours of the calculated resources in the last 3 months. |
View: BEASV_RESOURCE_UTILIZATION."PlannedCapacity" |