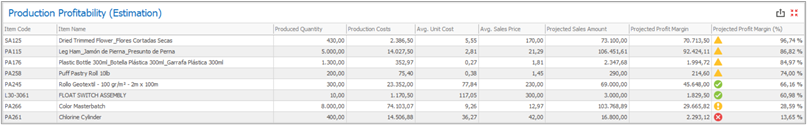
With this report, you can have a deeper understanding on which items are more or less profitable to produce. The report lists all items produced over the selected time range, detailing the production amounts and costs, and getting the average sales price for each product. Then, the following calculations are performed:
a)Projected Sales Amount: Produced quantity multiplied by average sales price. This column represents the estimated revenue for selling the entire production;
b)Projected Profit Margin: Projected sales amount discounted of production costs. This column represents the estimated gross profit for selling the entire production;
c)Projected Profit Margin (%): Projected profit margin divided by projected sales amount. This column represents the percent of estimated profit margin for selling the entire production.
By default, four icons can be presented by this report. The icons can be customized by editing the dashboard and defining new color rules.
![]() Profit margin greater than 70%. Can indicate costing errors or undesirably high profits.
Profit margin greater than 70%. Can indicate costing errors or undesirably high profits.
![]() Profit margin between 35% and 70%
Profit margin between 35% and 70%
![]() Profit margin between 20% and 35%
Profit margin between 20% and 35%
![]() Profit margin lower than 20%
Profit margin lower than 20%