Quantities by sales order
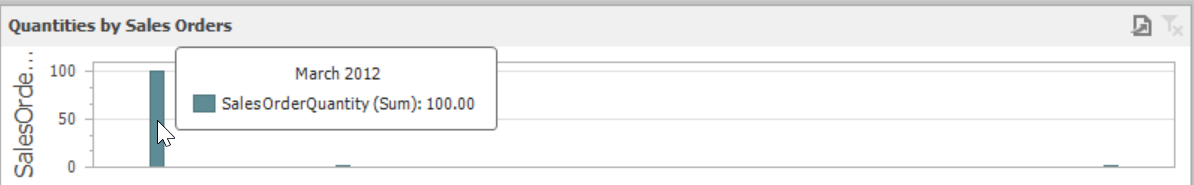
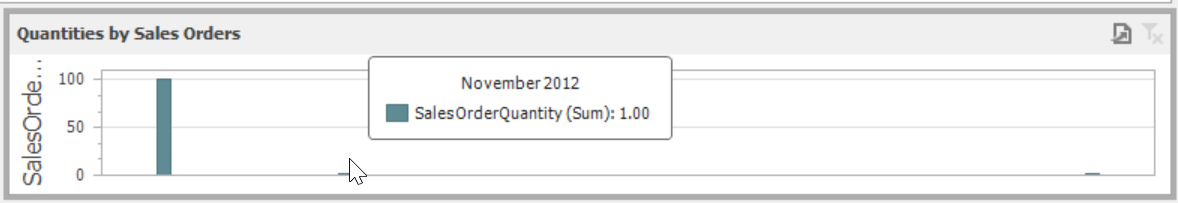
This bar graph shows the total item quantity for sales orders.
This indicator includes by default the last 12 months as the date range, only items with procurement mode set to Make and only sales orders that have not been canceled.
Column |
Description |
Table Field |
Sales Order Quantity |
Total sales order quantity for the selected item in warehouse units. |
View: "BEASV_ITEM_SALES_ORDER"."Quantity" |
Shipment date |
The month and year of the shipment date (only the last 12 months are selected by default). |
View: "BEASV_ITEM_SALES_ORDER"."ShipDate" |
Quantities by production
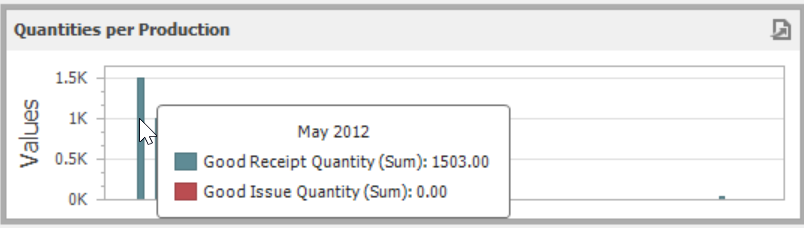
This bar graph shows the total item quantity for goods issue in production and the total item quantity for goods receipts from production.
This indicator includes by default the last 12 months as the date range, only items with procurement mode set to Make and only the entries for goods issue and goods receipts for production that have not been canceled.
Column |
Description |
Table Field |
Good Issue Quantity |
Total goods issue quantity for production for the selected item in warehouse units. |
View: "BEASV_ITEM_PRODUCTION"."GoodIssueQuantity" |
Good Receipt Quantity |
Total the goods receipt quantity from production for the selected item in warehouse units. |
View: "BEASV_ITEM_PRODUCTION"."GoodReceiptQuantity" |
Document date |
The month and year of the document date (only the last 12 months are selected by default). |
View: "BEASV_ITEM_PRODUCTION"."DocDate" |
Average Unit Price
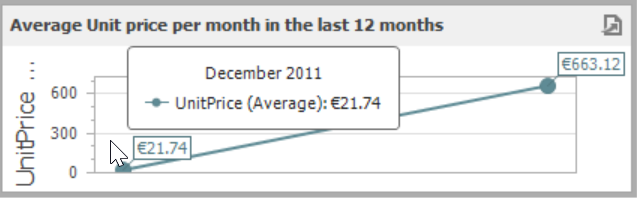
This line graph shows the average item price in goods receipts from production. The average is calculated per month.
This indicator includes by default the last 12 months as the date range, only items with procurement mode set to Make and only the entries for goods receipts from production that have not been canceled.
Column |
Description |
Table Field |
Unit Price (Average) |
The price for the item in the goods receipt document. The average price per month is calculated in the graph. |
View: "BEASV_ITEM_PRODUCTION"."UnitPrice" |
Document date |
The month and year of the document date (only the last 12 months are selected by default). |
View: "BEASV_ITEM_PRODUCTION"."DocDate" |
Average cost per unit
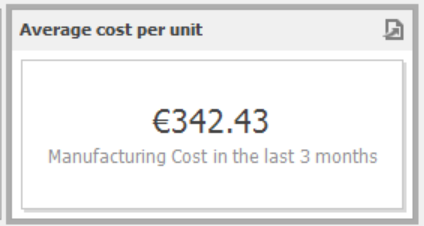
This line graph shows the average item price in goods receipts from production. The average is calculated using the item manufacturing price for the last 3 months.
This indicator includes by default the last 3 months as the data range, only items with procurement mode set to Make and only the entries for goods receipts from production that have not been canceled.
Column |
Description |
Table Field |
Unit Price in the last 3 months (Average) |
The price for the item in the goods receipt document. The average price per month is calculated in the graph. |
Calculated field in dashboard editor: Iif(DateDiffMonth([DocDate], Today()) <= 3 And [DocDate] <= Today(), [UnitPrice], 0) |
Unit Price |
The price for the item in the goods receipt document. |
View: "BEASV_ITEM_PRODUCTION"."UnitPrice" |
Document date |
The month and year of the document date. |
View: "BEASV_ITEM_PRODUCTION"."DocDate" |
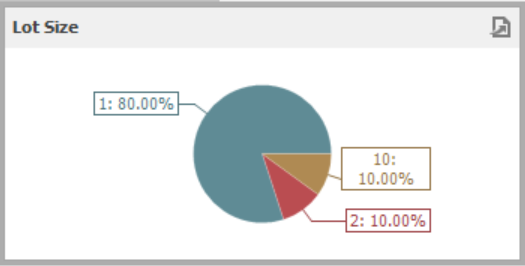
Lot Size
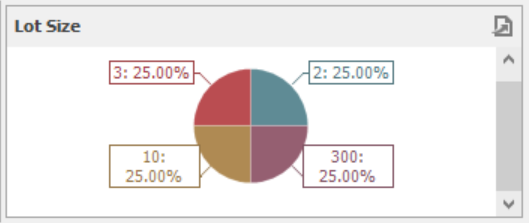
This pie chart that shows the percentage of the lot sizes for the good receipts of the item selected. The percentage represents the amount of work orders that have their lot sizes.
This indicator includes by default the last 10 work orders, and only items with procurement mode set to Make.
Query for choosing the lot sizes from the last 10 work orders (MSSQL/HANA):
Only modify the 10 after the highlighter RowNumber to choose the last n number of work orders.
SELECT "Total Quantity",
"ItemCode"
FROM
(SELECT "QuantityWhsUnit" AS "Total Quantity",
"StartDate",
"ItemCode",
ROW_NUMBER()
over (Partition BY "ItemCode"
ORDER BY "StartDate" DESC ) AS "RowNumber"
FROM "BEASV_WORKORDER_POS"
WHERE "AutomaticallyScheduled" =1)AS "InnerQuery" WHERE "RowNumber" <=10
Column |
Description |
Table Field |
Item Code |
Item code. |
VIEW: BEAS_WORKORDER_POS.ItemCode |
Lot Size |
The total quantity (lot size) in the work order position for the selected item in warehouse units. |
VIEW: BEAS_WORKORDER_POS.QuantityWhsUnit |
Example of an item that has four good receipts. One of them has lot size=2, the next one has lot size=300, another one has lot size=10 and the last one has lot size=3. Therefore each of the lot sizes are represented in 25% of the chart.
Example of an item that has lot sizes set to 1 more often (80%) than the rest of its lot sizes, which are 10 and 2.