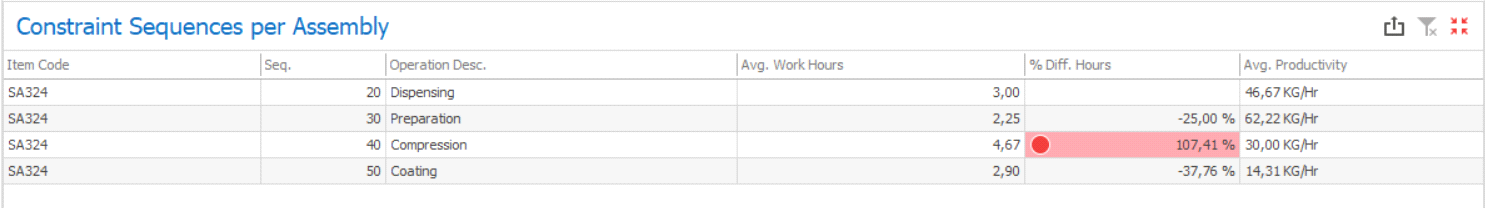
This grid displays all the manufacturing stages (routing positions) for each assembly and their average productivities per hour, as well as the variations between them. The Assembly grid presents the following information:
a)Item Code: Identification of the assembly;
b)Seq.: ID of the routing position;
c)Operation Desc.: Description of the routing position;
d)Avg. Work Hours: Average net work hours registered for each routing position executed for the assemblies’ manufacturing. The net work hours are calculated by discounting the non-workable hours (according to the resources’ calendars) from the work hours when the time receipts last for more than one day. If the first start or last end happened before or after the resources’ available hours, those are not discounted and are considered as overtime (the discounts are only applied to the days in between the first and last days);
e)% Diff. Hours: Percentual variation in between the productivity of the current routing position and the previous one. The differences are highlighted in a red scale, with a stronger red representing a higher variation. Additionally, all percentual differences higher than 50% are identified with a ![]() red circle.
red circle.
f)Avg. Productivity: How much of the assemblies’ unit of measures were produced during the total net work hours registered for each routing position (this grid does not consider different UoMs per routing position, the UoMs are read directly from the assembly).
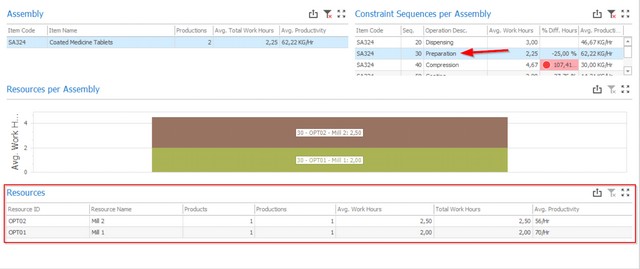
To understand which resource or resources were used in each routing position, you could either check the Resources per Assembly chart or click on a routing position and check the results under the Resources grid.