|
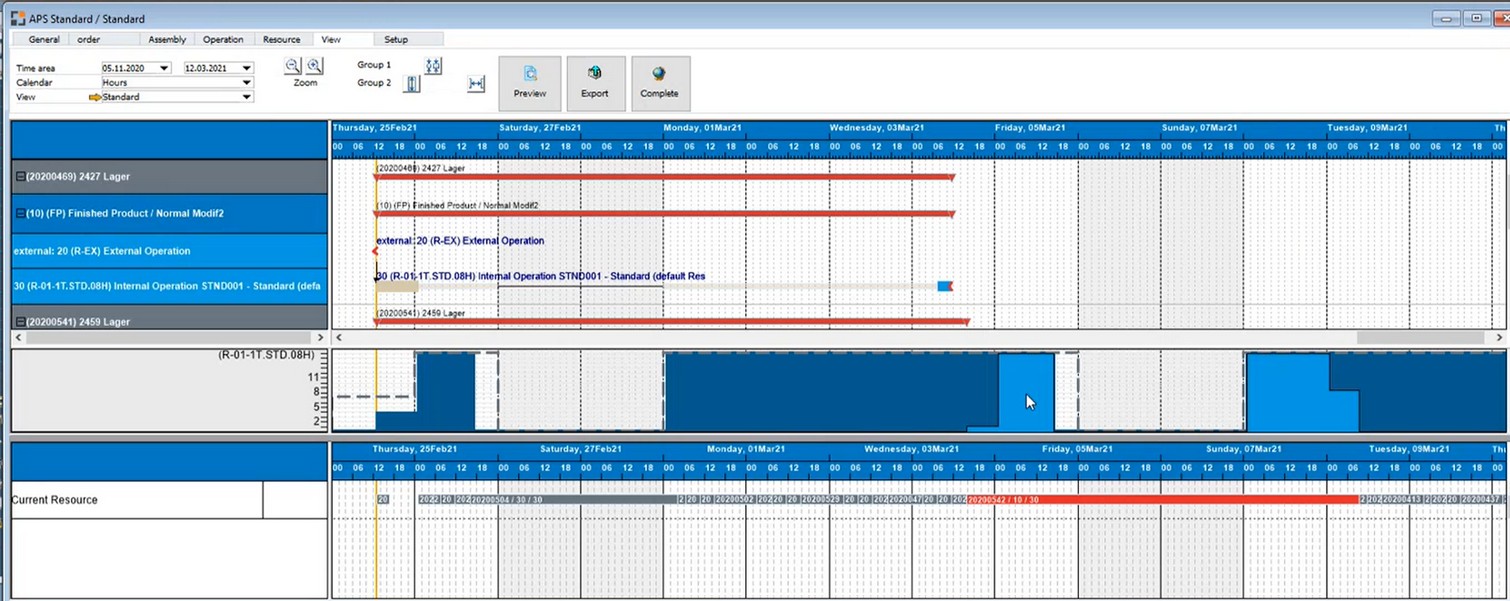
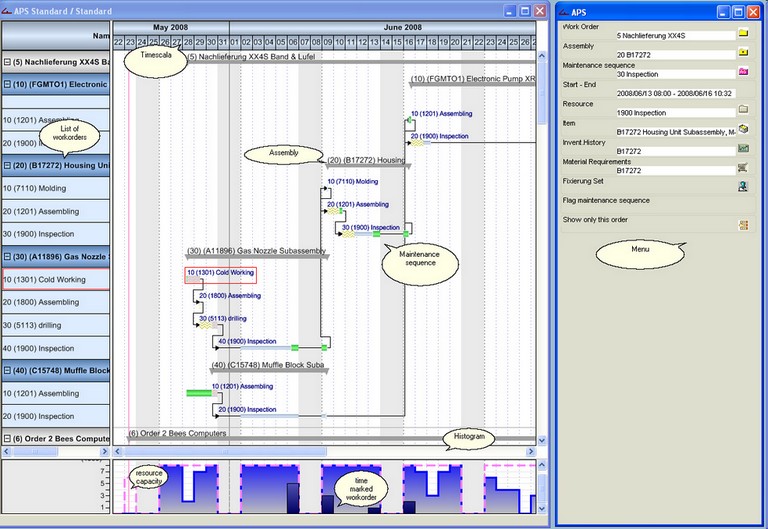
This chapter details the structural elements of the graphic view of the APS calculation result.


Structure in detail
Description
|
The groupings (production order / resource) and work sequences are described here.
|
Time/date area
|
Date / time line with the following options:
| • | Left-click, hold and move left/right: The time line is compressed or expanded. |
| • | Right-click on time line: The right-hand menu lists options for the time line, |
e.g. area to be displayed, time line type (day/hour/month, etc.)
|
Gantt
|
The work sequences and totals bars (groupings) are displayed here
The following functions are available here:
| • | Left-click on an empty area: The menu lists all relevant functions such as e.g. calculation functions and display options including print and export options. |
| • | Left-click on a work sequence: The menu lists all relevant functions for the work sequence. You can access further information and also calculation functions or alternative resources. |
| • | Right-click on a position: The utilization of the resource stored in the operation is displayed in the histogram area |
| • | Left-click on a work sequence, hold and move: This moves the work sequence along the time line and you can then instantly fix and schedule it depending on your configuration. |
| • | Selection of multiple positions (left-click and drag to form a rectangle or select individual work sequences using Ctrl+key+left mouse button): Group functions are displayed in the right menu window. For more, see Group functions. |
|
Histogram
|
The resource utilization's are displayed in this area when you right-click on a position. If you click the histogram, all work orders that have a time reservation for this resource are displayed in the menu. The period and / or display in Gantt chart do not matter.
|
Help URL: https://help.beascloud.com/beas202103/index.html?aufbau2.htm
|

