Active Resources and Tools Interruptions
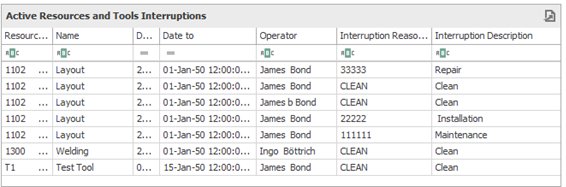
This grid shows relevant information about the current interruptions of tools and resources.
There is no default data range limit. It is up to the user to select a data range suitable for their needs. This indicator includes active resources and tools only, resources with capacity planning and active interruptions only. It excludes the resources set for service or cost.
To change data ranges, see the suggestions in Positions area, the following are examples applied to this grid in MSSQL:
--Interruption’s data which started during the date range between three months ago and today:
( BEASV_INTERRUPTIONS.“DateFrom“ >= DATEADD(MONTH, -3, GETDATE()) AND BEASV_INTERRUPTIONS.DateFrom < GETDATE())
--Interruption’s data which ended during the data range between the last 3 months until today:
AND (BEASV_INTERRUPTIONS.“DateTo“ >= DATEADD(MONTH, -3, GETDATE()) AND BEASV_INTERRUPTIONS.“DateTo“ < GETDATE())
--Selecting only a top "n" of the interruptions, it is recommended to order by date when applying the top function. Example of top 10:
SELECT TOP(10) … (rest of the query)
Column |
Description |
View Info |
Type |
Type of interruption: resource or tool. |
View: BEASV_INTERRUPTIONS.Type |
Id |
Resource or tool ID. |
View: BEASV_INTERRUPTIONS.ResourceOrToolId |
Name |
Resource or tool name. |
View: BEASV_INTERRUPTIONS.Name |
Date from |
Date from. Use this parameter or ‘Date to’ to change the date range. |
View: BEASV_INTERRUPTIONS.DateFrom |
Date to |
Date to. Use this parameter or ‘Date from’ to change the date range. |
View: BEASV_INTERRUPTIONS.DateTo |
Operator |
The operator logged in. |
View: BEASV_INTERRUPTIONS.Operator |
Interruption Reason Id |
Interruption Reason ID. |
View: BEASV_INTERRUPTIONS.InterruptionReasonId |
Interruption Description |
Interruption description. |
View: BEASV_INTERRUPTIONS.InterruptionDescription |
Interruption Status |
Interruption Status: Active, Planned, Complete. |
View: BEASV_INTERRUPTIONS.InterruptionStatus |
Planned resource and tool’s interruption
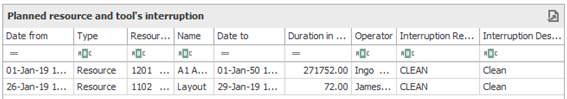
This grid shows relevant information about the planned interruptions for tools and resources.
There is no default data range limit. It is up to the user to select a data range suitable for their needs. This indicator includes planned interruptions only.
To change data ranges, see the suggestions in Positions area, the following are examples applied to this grid in MSSQL:
--Interruption’s data which started during the date range between three months ago and today:
( BEASV_INTERRUPTIONS.“DateFrom“ >= DATEADD(MONTH, -3, GETDATE()) AND BEASV_INTERRUPTIONS.DateFrom < GETDATE())
--Interruption’s data which ended during the data range between the last 3 months until today:
AND (BEASV_INTERRUPTIONS.“DateTo“ >= DATEADD(MONTH, -3, GETDATE()) AND BEASV_INTERRUPTIONS.“DateTo“ < GETDATE())
--Selecting only a top "n" of the interruptions, it is recommended to order by date when applying the top function. Example of top 10:
SELECT TOP(10) … (rest of the query)
Column |
Description |
View Info |
Type |
Type of interruption: resource or tool. |
View: BEASV_INTERRUPTIONS.Type |
Id |
Resource or tool ID. |
View: BEASV_INTERRUPTIONS.ResourceOrToolId
|
Name |
Resource or tool name. |
View: BEASV_INTERRUPTIONS.Name
|
Date from |
Date from. Use this parameter or ‘Date to’ to change the date range. |
View: BEASV_INTERRUPTIONS.DateFrom
|
Date to |
Date to. Use this parameter or ‘Date from’ to change the date range. |
View: BEASV_INTERRUPTIONS.DateTo
|
Duration |
Interruption duration in hours. |
View: BEASV_INTERRUPTIONS.InterruptionDuration
|
Operator |
The operator logged in. |
View: BEASV_INTERRUPTIONS.Operator
|
Interruption Reason Id |
Interruption reason ID. |
View: BEASV_INTERRUPTIONS.InterruptionReasonId
|
Interruption Description |
Interruption description. |
View: BEASV_INTERRUPTIONS.InterruptionDescription
|
Interruption Status |
Interruption Status: Active, Planned, Complete. |
View: BEASV_INTERRUPTIONS.Status
|
Resource Interruption’s reasons
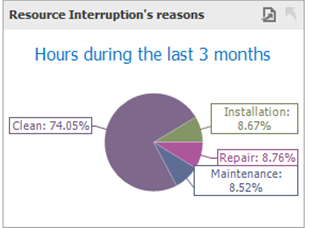
This pie chart shows the percentage of hours of different interruption reasons compared to the total sum of interruption hours for resources.
This indicator includes the last three months as the data range, active resources only with capacity planning and it excludes the resources set for service or cost. Only the interruptions that have the status completed or active are taken into consideration for this gauge.
Data item |
Description |
View Info |
Duration until today |
Interruption duration up until the current day. If the interruption has an end date in the future, then the duration is calculated only until the current day, otherwise it is calculated as the start date time minus the end date time. |
View: BEASV_INTERRUPTIONS.InterruptionUntilToday
|
Interruption Description |
Interruption description. |
View: BEASV_INTERRUPTIONS.InterruptionDescription
|