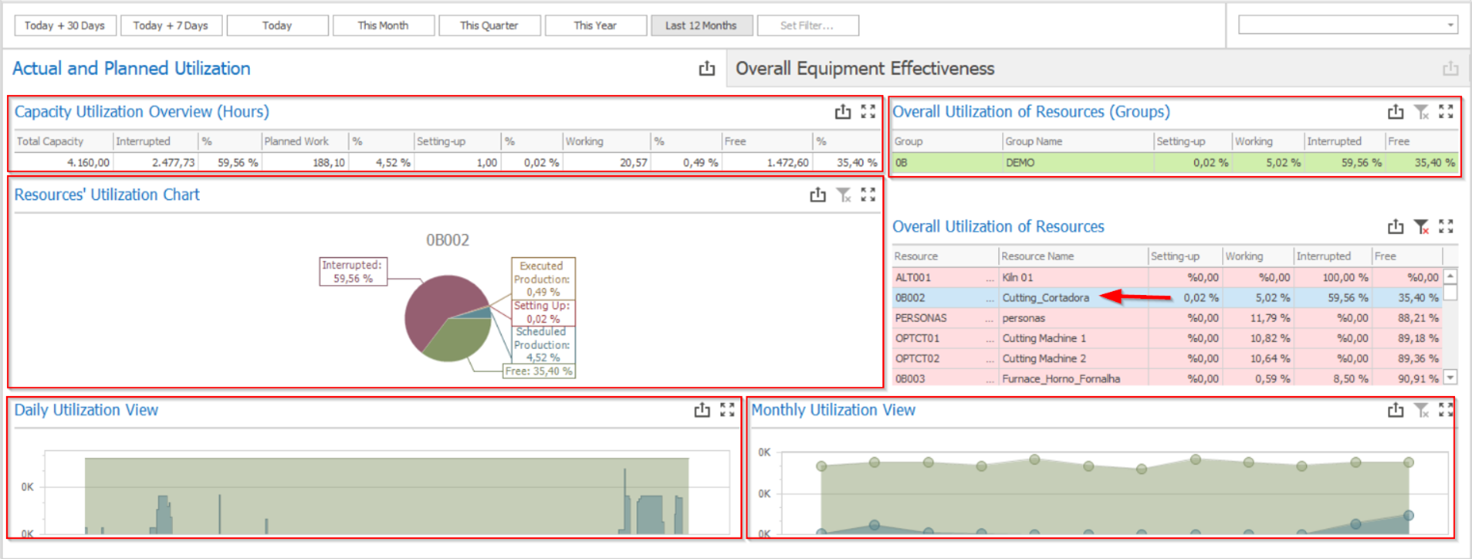
This report details how the capacities of the resources are used, revealing the following information:
a)Setting-Up: Total setup times registered for the resource;
b)Working: Total scheduled and executed work times registered for the resource;
c)Interrupted: Total interruption hours registered for the resource;
d)Free: Remaining capacity after discounting interruptions, scheduled work, setup times, and work times.
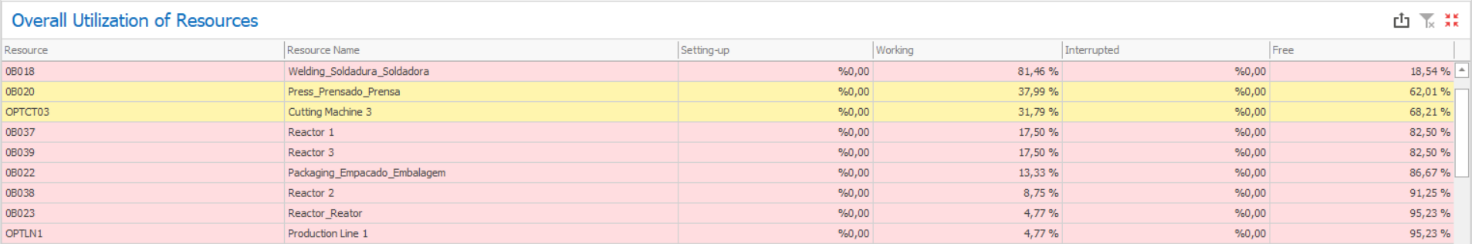
By default, three colors can be applied to the report rows. The colors can be customized by editing the dashboard and defining new color rules.
Red: Free capacity greater than 80%, or less than 20%;
Yellow: Free capacity between 40% and 80%;
Green: Free capacity between 20% and 40%;
Any resource can be selected for further insights on how its capacity is or was used (triggering filters on the other reports and charts from the dashboard). If you wish to check how the capacities of a single resource were used, you can just click on the desired resource and check the results under the Capacity Utilization Overview (Hours), the Resources’ Utilization Chart (Groups), the Daily Utilization View, the Monthly Utilization View, and the Overall Utilization of Resources (Groups) sections.