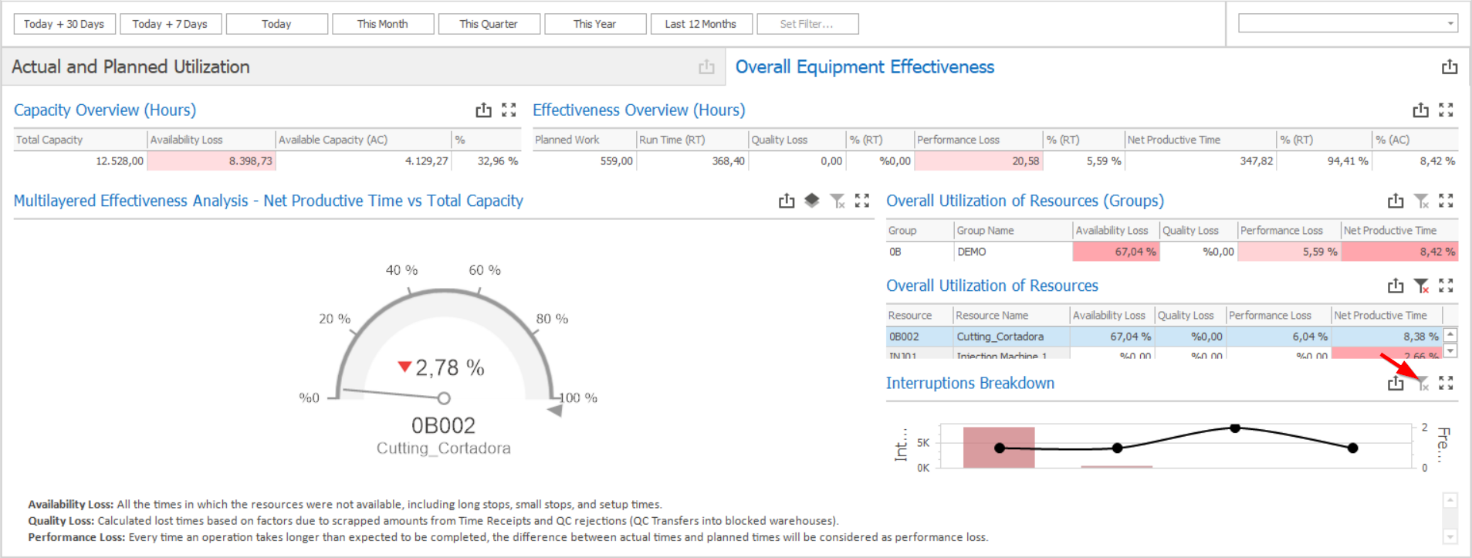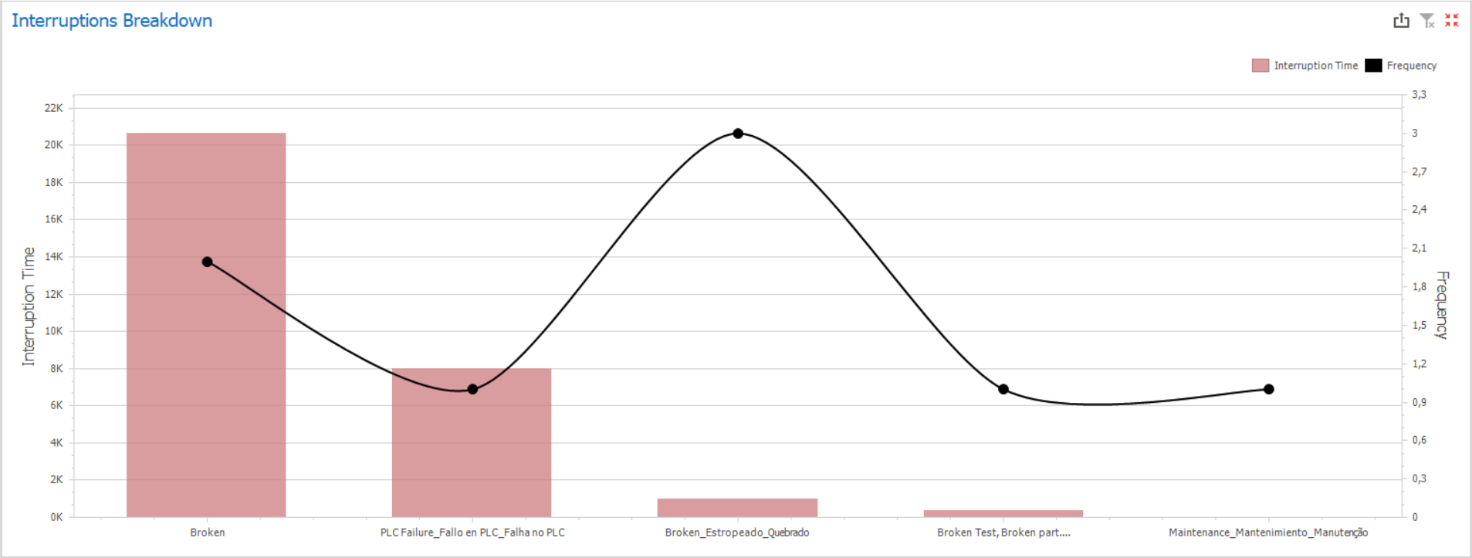
This chart combines two information in a single view: times lost for each interruption reason (red bars) and the frequency of each interruption reason (black line).
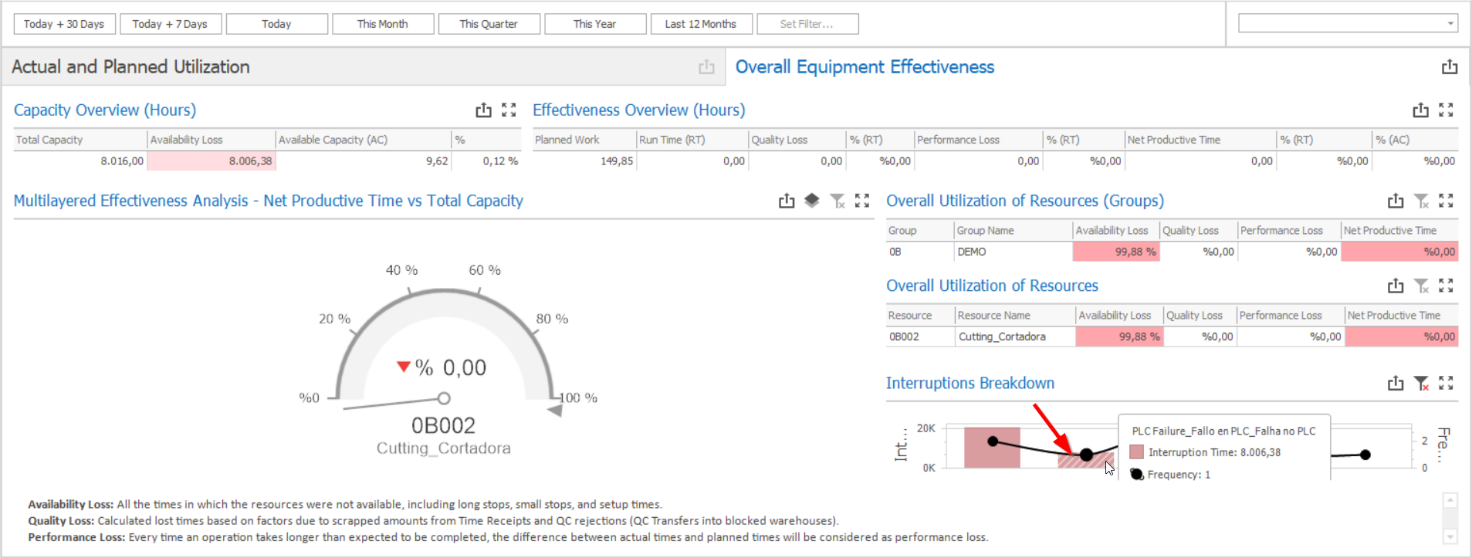
Important: It is possible to click on a specific interruption reason to check which resources were affected by that particular interruption. However, clicking on an interruption reason will make the dashboard to filter only for interruption transactions, making the KPIs to show incorrect values, as production transactions will not be correctly calculated. If you wish to understand which resources were affected by certain interruptions and what are their corresponding OEEs, you should:
1) Click on the interruption reason to filter the resources:
2) Select the resource groups or resources using the “Overall Utilization of Resources (Groups)” or “Overall Utilization of Resources” grids:
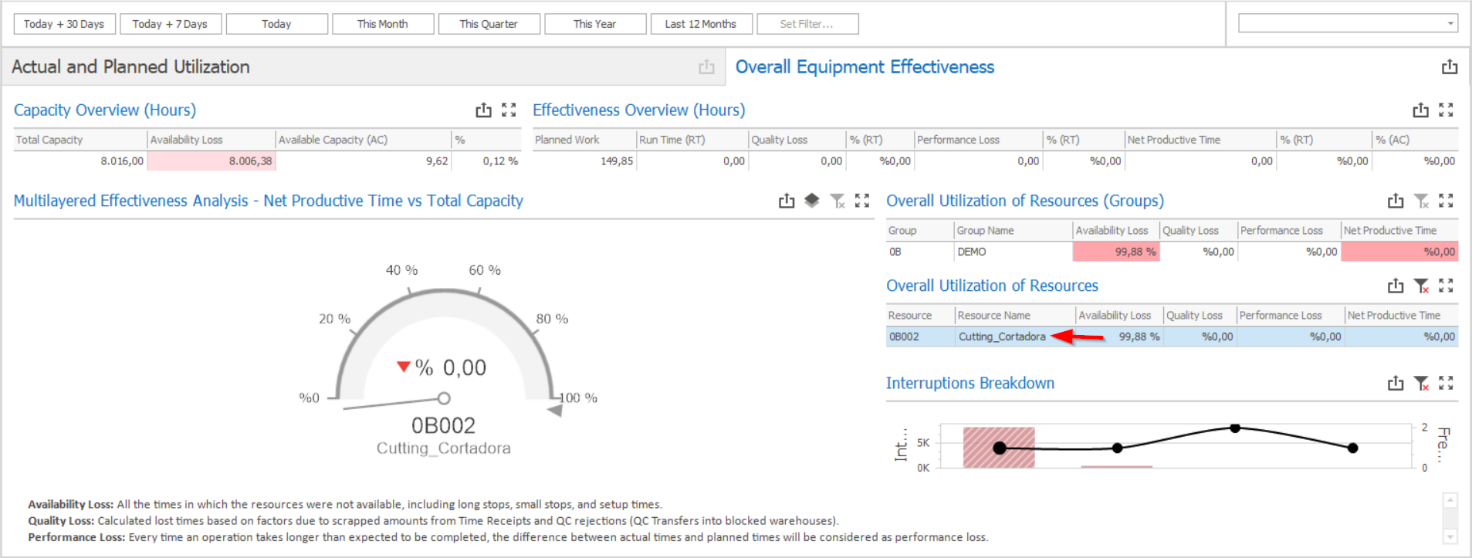
3) Clear the interruptions filter: